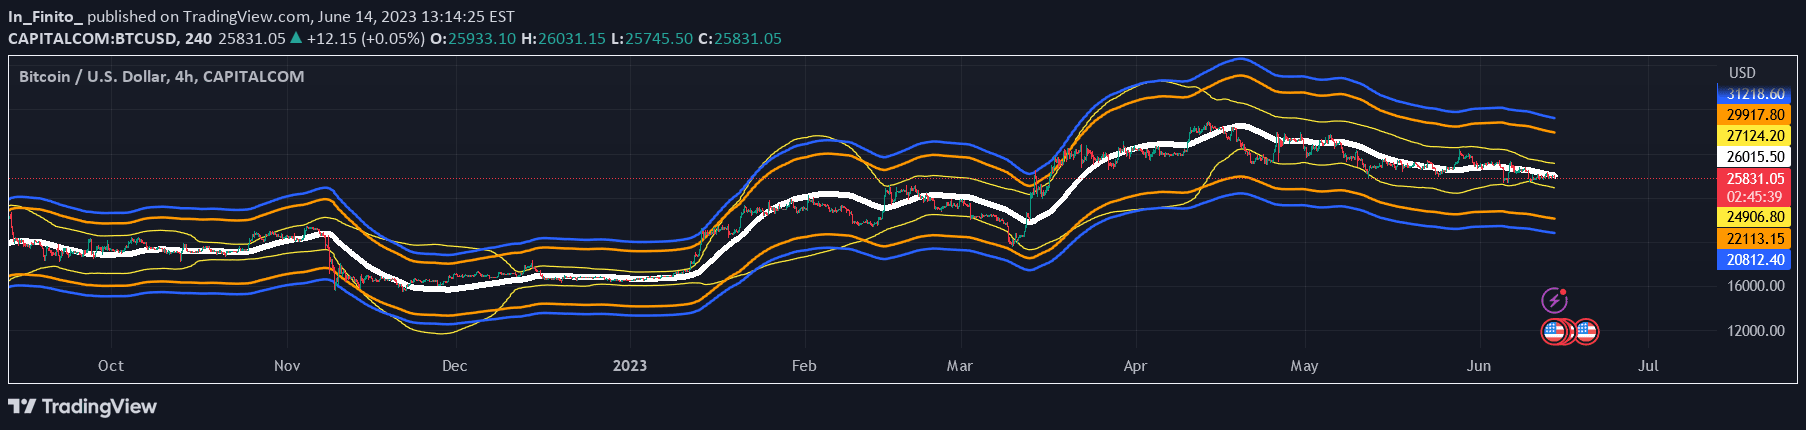
Fibonacci Volatility Bands are alternative technical analysis bands using Fibonacci sequence moving averages to measure price volatility and potential market movements.
Explore complementary indicator rolesHow it works
Fibonacci Volatility Bands are constructed using moving averages with lookback periods derived from the Fibonacci sequence, creating dynamic price channels. These bands adapt to market volatility by calculating average price movements based on mathematical sequences that reflect natural market rhythms.
By incorporating Fibonacci numbers into moving average calculations, the bands expand and contract around price action, providing visual representations of potential support and resistance levels. Traders can identify potential trend reversals, overbought or oversold conditions, and measure price volatility through the width and positioning of these adaptive bands.
Why it may be useful
Fibonacci Volatility Bands offer traders a sophisticated method for understanding market dynamics by integrating mathematical sequences with price movement analysis. They provide more flexible volatility measurements compared to traditional Bollinger Bands, allowing for more nuanced interpretation of market conditions.
These bands help traders identify potential trend changes, assess market volatility, and make more informed trading decisions by visualizing price fluctuations through mathematically derived channels. Their adaptive nature makes them valuable across different market conditions and trading timeframes.
When to explore it
Fibonacci Volatility Bands are most effective in markets with clear trending behavior and moderate to high volatility. They work exceptionally well when price is moving within consistent channels and experiencing predictable fluctuations based on historical price action.
Traders should utilize these bands during periods of potential trend reversals, when looking to identify potential entry and exit points, and when seeking to understand the underlying volatility of a financial instrument. They are particularly useful in forex, stock, and cryptocurrency markets where price movements can be complex and multifaceted.
Keep exploring
What we’ve verified
Access, alerts and repainting behaviour have not been independently verified for this indicator. Check the creator’s current publication and settings.
General descriptions and classifications are recovered research. Verified details above identify the specific checks we have completed. Check the creator’s current publication for later changes.