SuperBollingerTrend (Expo)
SuperBollingerTrend combines Bollinger Bands and SuperTrend to analyze market volatility and trend direction, providing traders insights into potential trend changes and breakouts.
Explore 11,183 indicators. Filter beyond the obvious.
Discover the tools that fit the way you trade.
11,183 tools to explore
SuperBollingerTrend combines Bollinger Bands and SuperTrend to analyze market volatility and trend direction, providing traders insights into potential trend changes and breakouts.
A comprehensive trading indicator that combines Money Flow Index, Relative Strength Index, and Bollinger Bands to generate precise buy and sell signals based on technical analysis.
The Hullinger Bands Indicator combines Hull Moving Averages and Bollinger Bands to provide advanced trend and volatility analysis with dynamic color-coded signals.
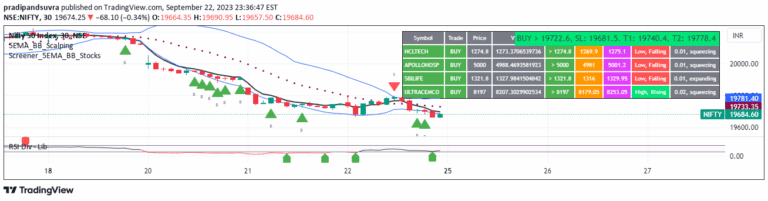
A dynamic trading scanner that identifies potential buy and sell signals for Nifty-50 stocks using 5-EMA and Bollinger Bands, providing real-time trade recommendations.
A technical analysis strategy combining Bollinger Bands and RSI to identify potential trading opportunities by measuring price volatility and momentum using standard deviation and relative strength.
A mean reversion trading signal using two Bollinger Bands sets to identify potential entry points in ranging markets with predefined stop loss and take profit levels.
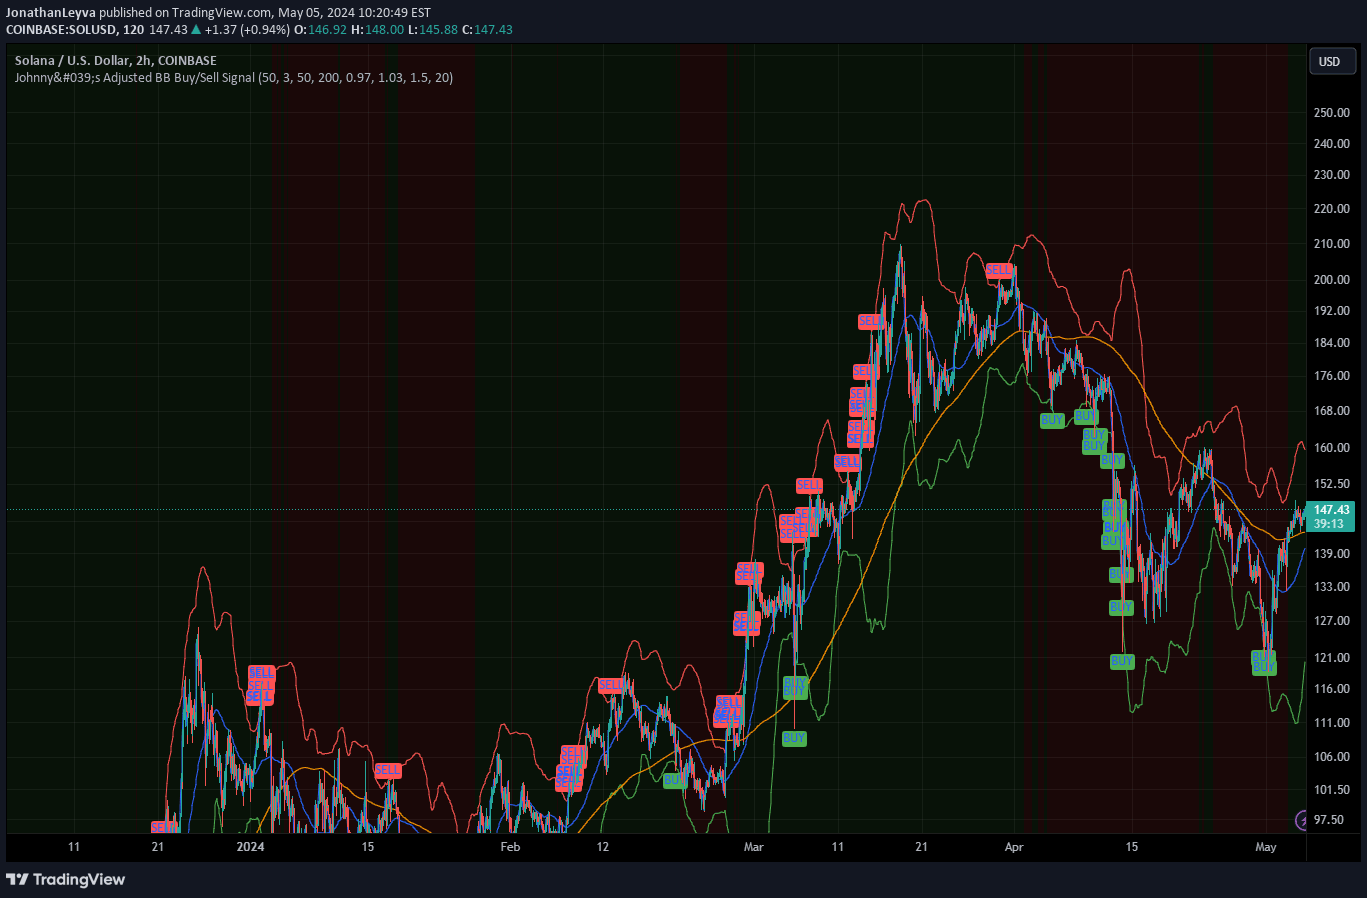
A multi-factor trading strategy combining RSI, EMA, MACD, and volatility analysis to generate precise buy and sell signals across multiple market conditions.
Banded Chikou Breakout enhances Ichimoku trading by quantifying Chikou Span momentum through Bollinger Bands, helping traders identify significant market breakouts with precision.
A dynamic trading signal using Bollinger Bands and moving averages to identify strategic entry and exit points by analyzing market volatility and trend conditions.
A multi-Bollinger Bands indicator using linear regression to calculate trend lines and deviation zones, helping traders identify potential price reversals and overbought/oversold conditions.
Fibonacci Volatility Bands are alternative technical analysis bands using Fibonacci sequence moving averages to measure price volatility and potential market movements.
A dynamic trading indicator that adjusts entry, take-profit, and stop-loss levels using Bollinger Bands and adaptive price tracking to provide actionable market insights across multiple timeframes.
Likes, views, and comments are historical TradingView snapshots. They describe attention, not trading performance.