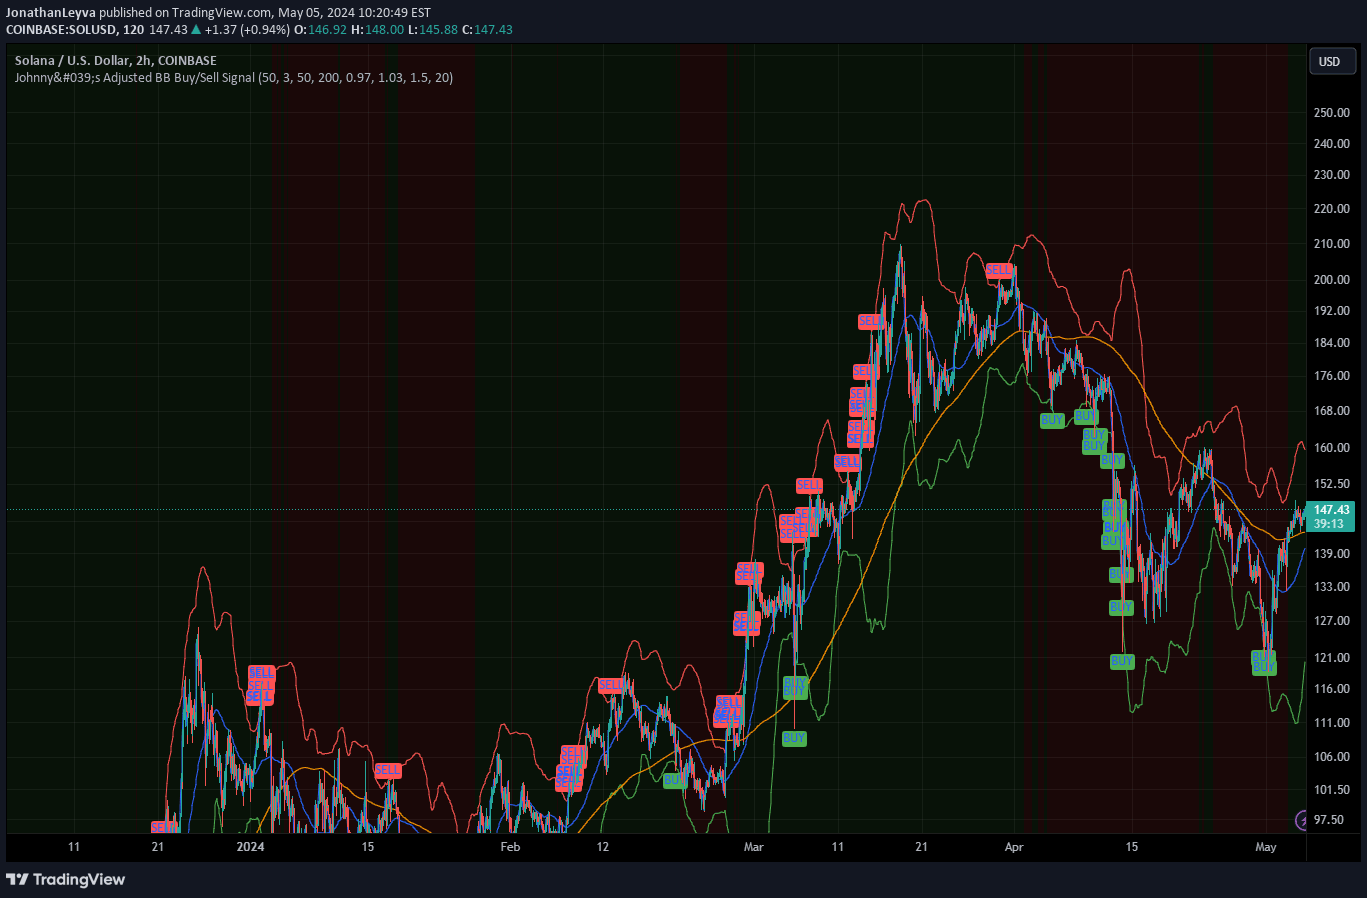
A technical analysis strategy combining Bollinger Bands and RSI to identify potential trading opportunities by measuring price volatility and momentum using standard deviation and relative strength.
Explore complementary indicator rolesHow it works
The Bollinger Band Alert with RSI Filter operates by first calculating Bollinger Bands around a simple moving average of price, using standard deviation to plot upper and lower bands. These bands dynamically adjust to price volatility, expanding during high volatility and contracting during low volatility periods.
Simultaneously, the Relative Strength Index (RSI) measures momentum by comparing recent price gains to recent price losses, generating values between 0 and 100. The strategy generates trading signals when price crosses the Bollinger Bands and the RSI indicates overbought or oversold conditions, suggesting potential trend reversals or continuation.
Why it may be useful
This indicator provides traders with a comprehensive view of market conditions by combining trend, momentum, and volatility analysis into a single signal. By integrating Bollinger Bands' volatility measurement with RSI's momentum assessment, traders can make more informed decisions about potential entry and exit points.
The dual-indicator approach helps reduce false signals by requiring confirmation from both price movement and momentum, thereby increasing the probability of successful trades and offering a more nuanced market interpretation than single-indicator strategies.
When to explore it
The Bollinger Band Alert with RSI Filter works best in markets with clear trending characteristics and moderate volatility. It is particularly effective in liquid markets like forex, stocks, and major cryptocurrency pairs where price movements are more predictable and consistent.
Traders should be cautious during extremely choppy or range-bound markets, as the signal may generate more false alerts. It is most reliable when used in conjunction with other technical analysis tools and fundamental market analysis to validate potential trading opportunities.
Keep exploring
What we’ve verified
Access, alerts and repainting behaviour have not been independently verified for this indicator. Check the creator’s current publication and settings.
General descriptions and classifications are recovered research. Verified details above identify the specific checks we have completed. Check the creator’s current publication for later changes.