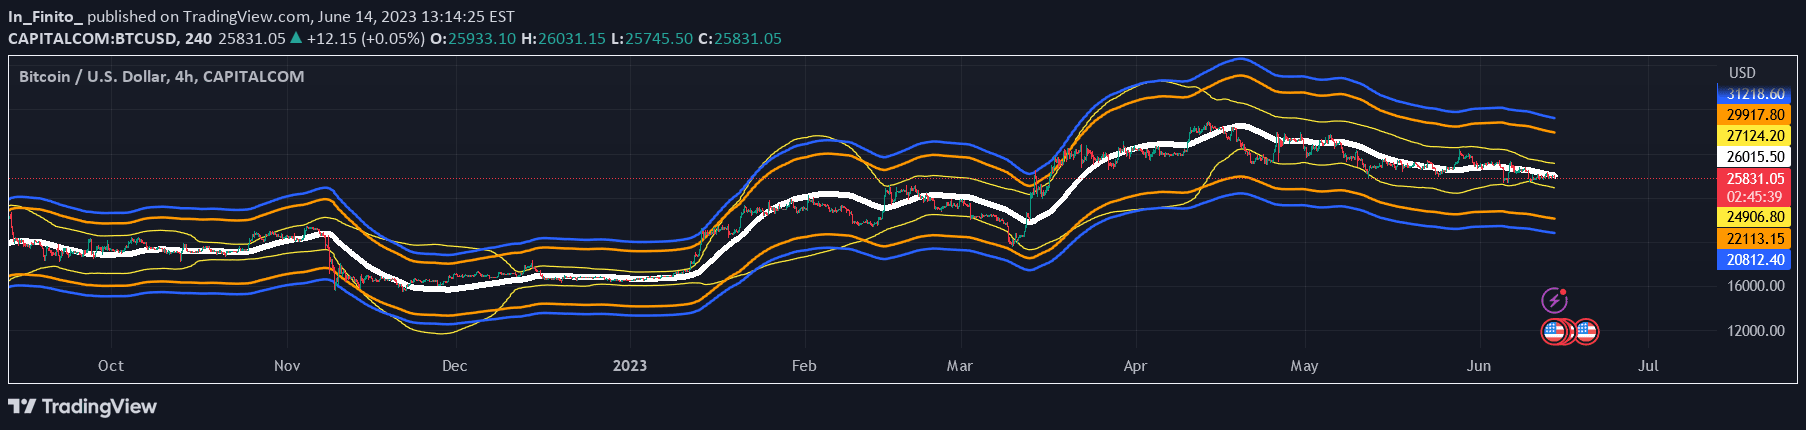
A dynamic trading signal using Bollinger Bands and moving averages to identify strategic entry and exit points by analyzing market volatility and trend conditions.
Explore complementary indicator rolesHow it works
The indicator calculates Bollinger Bands using a specified length and multiplier to identify potential overbought and oversold conditions. Two moving averages are calculated to determine market direction across different timeframes.
Market phases are classified as bullish or bearish based on the closing price relative to the long-term moving average. Strong buy and sell signals are generated by analyzing price deviation from Bollinger Bands, incorporating the average candle size and market sentiment.
Why it may be useful
This signal provides traders with a comprehensive view of market dynamics by integrating multiple technical analysis tools into a single indicator. It offers nuanced insights into market volatility, trend direction, and potential reversal points, enabling more informed trading decisions.
By combining Bollinger Bands and moving averages, the indicator helps traders identify strategic entry and exit points with greater precision. The flexible design allows customization to different trading styles and market conditions, making it a versatile tool for technical analysis.
When to explore it
The signal is most effective in markets with clear trend characteristics and notable price volatility. It works particularly well for traders seeking to identify potential trend reversals and continuation patterns across multiple timeframes.
Traders can leverage this indicator in both trending and ranging markets, adjusting the parameters to suit specific market conditions. It is especially useful for identifying overbought and oversold conditions, providing valuable insights for momentum and trend-following trading strategies.
Keep exploring
What we’ve verified
Access, alerts and repainting behaviour have not been independently verified for this indicator. Check the creator’s current publication and settings.
General descriptions and classifications are recovered research. Verified details above identify the specific checks we have completed. Check the creator’s current publication for later changes.