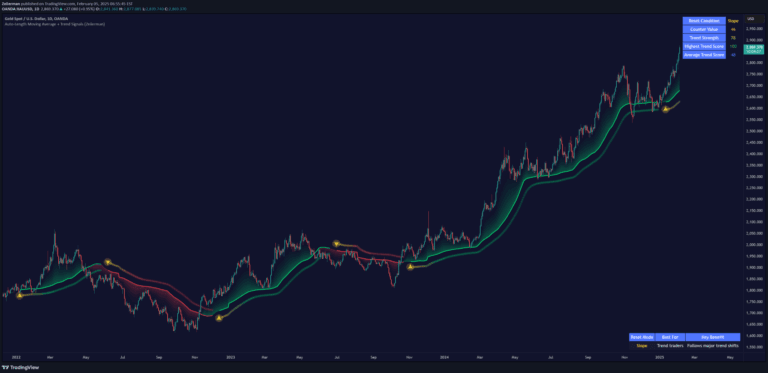
A sophisticated trading indicator combining Hull Moving Average with Gaussian filtering and volatility metrics to provide dynamic trend and momentum analysis across different market conditions.
Explore complementary indicator rolesHow it works
The HMA Gaussian Volatility Adjusted indicator operates by first applying a Hull Moving Average (HMA) to smooth price data, reducing market noise and focusing on broader trends. This smoothed data is then refined through a Gaussian filter, which incorporates a normal distribution to further enhance trend stability.
The indicator then measures market volatility using two key methods: Average True Range (ATR) and Standard Deviation (SD). By calculating upper and lower trend bands based on these volatility metrics, the indicator creates a dynamic framework for identifying potential price movements and trend changes.
Why it may be useful
This indicator provides traders with a comprehensive view of market dynamics by integrating multiple analytical techniques into a single, powerful tool. Its combination of HMA smoothing, Gaussian filtering, and volatility measurements allows for more nuanced trend detection compared to traditional single-metric indicators.
By offering customizable inputs for length, multipliers, and visualization, traders can adapt the indicator to various market conditions and personal trading styles. The multi-layered approach helps reduce false signals and provides a more robust method of identifying potential trend reversals and momentum shifts.
When to explore it
The HMA Gaussian Volatility Adjusted indicator is most effective in markets with clear but complex trend structures, where simple moving averages might provide incomplete information. It works particularly well in moderately volatile markets where price movements are significant enough to trigger meaningful signals but not so erratic that they create constant noise.
Traders should consider using this indicator during trending market periods, especially when seeking to confirm trend strength and potential reversal points. It is especially useful for traders who want a more sophisticated approach to trend analysis that goes beyond basic moving average crossovers.
Keep exploring
What we’ve verified
Access, alerts and repainting behaviour have not been independently verified for this indicator. Check the creator’s current publication and settings.
General descriptions and classifications are recovered research. Verified details above identify the specific checks we have completed. Check the creator’s current publication for later changes.