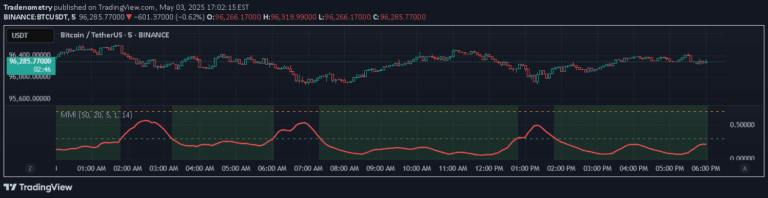
A sophisticated trend analysis tool using Gaussian filtering to detect market trends, volatility, and potential reversals with dynamic bands and strength indicators.
Explore complementary indicator rolesHow it works
The Volatility Gaussian Bands indicator operates by applying a Gaussian filter to smooth price data and create dynamic trend bands. It calculates these bands based on market volatility, with an upper and lower band that adjusts in real-time to current market conditions.
The system generates multiple analytical components, including trend strength gauges and rapid trend change indicators. These components work together to provide a comprehensive view of market movement, with triangular signals marking potential trend reversals and retests of the Gaussian midline.
Why it may be useful
Traders need precise trend detection tools to make informed decisions in volatile markets, and this indicator provides a nuanced approach to understanding price movements. By smoothing price data and creating adaptive bands, it helps traders identify underlying market trends more accurately than traditional methods.
The indicator's multi-layered analysis offers insights beyond simple trend direction, revealing trend strength, potential reversals, and quick market shifts. This comprehensive approach allows traders to develop more sophisticated strategies and respond more effectively to changing market conditions.
When to explore it
The Volatility Gaussian Bands indicator is most effective in markets with clear directional movements and moderate to high volatility. It performs exceptionally well in trending markets where price exhibits consistent directional momentum, allowing traders to capture extended price moves.
Traders should apply this tool across multiple timeframes, from short-term scalping to longer-term swing trading. It is particularly useful during periods of market transition, such as when prices are breaking out of consolidation zones or showing early signs of trend reversal.
Keep exploring
What we’ve verified
Access, alerts and repainting behaviour have not been independently verified for this indicator. Check the creator’s current publication and settings.
General descriptions and classifications are recovered research. Verified details above identify the specific checks we have completed. Check the creator’s current publication for later changes.