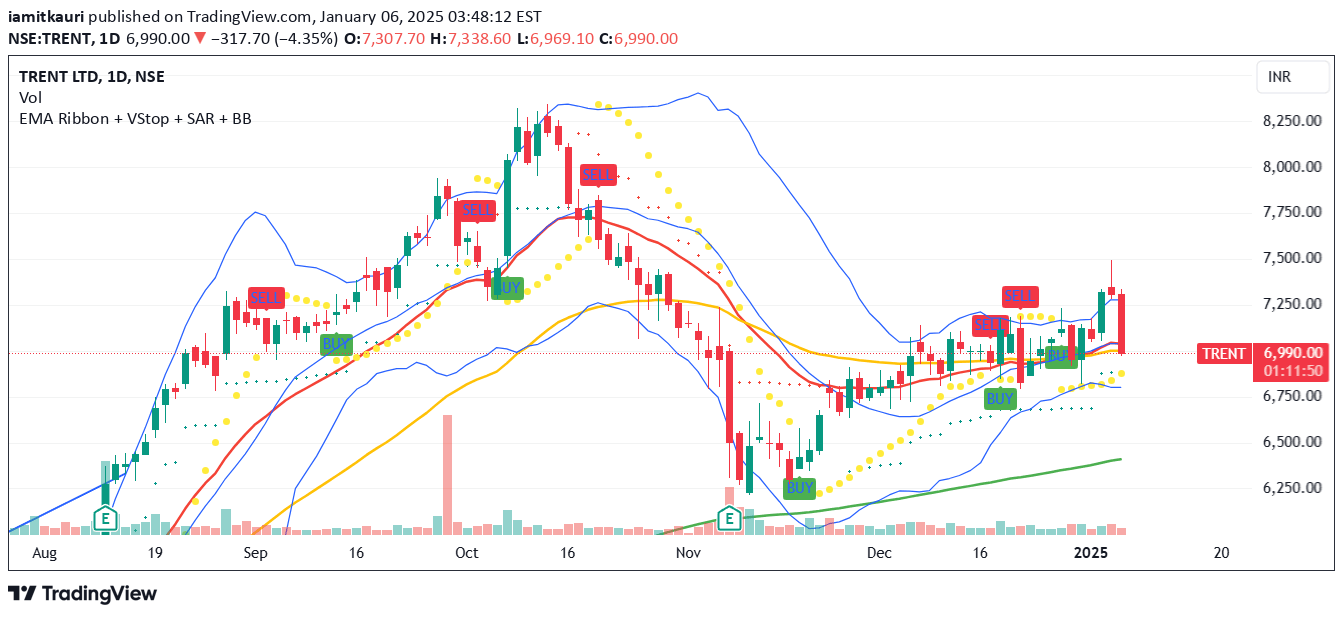
Bollinger Bands ForLoop is an advanced indicator that calculates trend signals by analyzing price movements across multiple lengths and moving averages to reduce market noise.
Explore complementary indicator rolesHow it works
The Bollinger Bands ForLoop operates by calculating an array of values between 1 and -1 based on whether the source data is above or below a basis line. It uses multiple moving average lengths to create a comprehensive trend analysis, smoothing out market fluctuations and reducing potential false signals.
The indicator evaluates different signal modes including fast, slow, threshold crossing, and fast threshold techniques. By comparing current and previous moving average values, it generates bullish or bearish signals, with the color changing between lime (bullish) and fuchsia (bearish) to visually represent market direction.
Why it may be useful
Traditional technical indicators often generate noise and false signals, making it challenging for traders to make accurate decisions. The Bollinger Bands ForLoop addresses this issue by implementing advanced smoothing techniques and multiple calculation methods to provide more refined trend insights.
By offering flexible signal modes and visual customizations, this indicator helps traders better understand market dynamics, reduce false signals, and potentially improve their trading strategy's accuracy and reliability.
When to explore it
The Bollinger Bands ForLoop is most effective when used in conjunction with other technical analysis tools and strategies, particularly on higher timeframes where market noise is reduced. It works best for traders seeking a comprehensive trend analysis that goes beyond traditional Bollinger Bands methodology.
Traders should exercise caution and avoid using this indicator in isolation, especially on lower timeframes where signal reliability decreases. It is recommended to combine this tool with additional confirmatory indicators and sound risk management principles to maximize its potential.
Keep exploring
What we’ve verified
Access, alerts and repainting behaviour have not been independently verified for this indicator. Check the creator’s current publication and settings.
General descriptions and classifications are recovered research. Verified details above identify the specific checks we have completed. Check the creator’s current publication for later changes.