
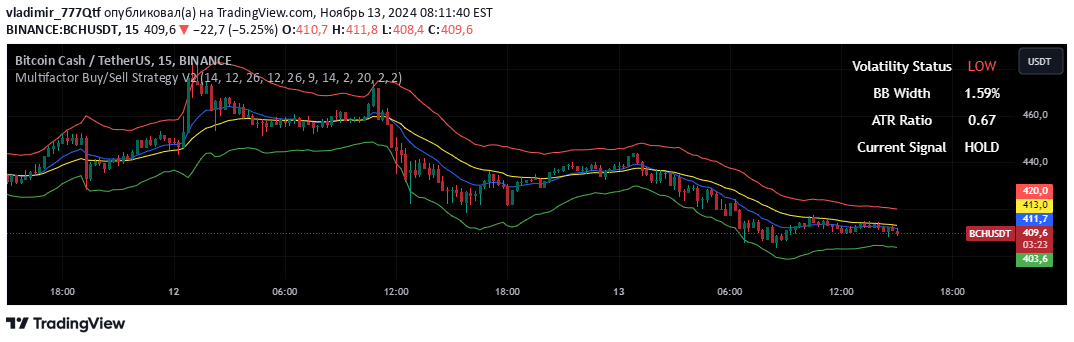
A multi-factor trading strategy combining RSI, EMA, MACD, and volatility analysis to generate precise buy and sell signals across multiple market conditions.
Explore complementary indicator rolesHow it works
The multifactor strategy generates trading signals by analyzing multiple technical indicators simultaneously. It evaluates trend direction through EMA crossovers, momentum through RSI levels, and market conditions using volatility metrics like ATR and Bollinger Bands.
The algorithm combines these indicators to create comprehensive buy and sell signals, filtering for specific conditions such as oversold/overbought states, positive/negative MACD histogram, and sufficient market volatility. By integrating various technical analysis components, the strategy provides a robust approach to identifying potential trading opportunities.
Why it may be useful
This multifactor strategy offers traders a comprehensive approach to market analysis by reducing reliance on single-indicator decisions. By integrating trend, momentum, and volatility indicators, traders can make more informed and statistically robust trading choices with reduced emotional bias.
The strategy's strength lies in its ability to filter out low-probability trades and focus on high-quality signals that meet multiple technical criteria. This approach helps traders minimize false signals and improve overall trading performance across different market conditions.
When to explore it
The strategy is most effective in markets with clear trend movements and sufficient volatility, making it ideal for cryptocurrency, forex, and active stock trading environments. It performs best when market conditions demonstrate distinct directional movements and meaningful volume fluctuations.
Traders should apply this strategy during periods of moderate to high market volatility, where multiple technical indicators can provide complementary insights. It is particularly useful in trending markets where momentum and technical signals align, offering traders a structured approach to identifying potential entry and exit points.
Keep exploring
What we’ve verified
Access, alerts and repainting behaviour have not been independently verified for this indicator. Check the creator’s current publication and settings.
General descriptions and classifications are recovered research. Verified details above identify the specific checks we have completed. Check the creator’s current publication for later changes.


