Pivot Highs&lows: Short/Medium/Long-term + Spikeyness Filter
A fractal-based pivot analysis tool that identifies and grades pivot highs and lows across short, medium, and long-term timeframes to help traders understand market structure.
Explore 11,183 indicators. Filter beyond the obvious.
Discover the tools that fit the way you trade.
11,183 tools to explore
A fractal-based pivot analysis tool that identifies and grades pivot highs and lows across short, medium, and long-term timeframes to help traders understand market structure.
An advanced trading indicator combining Average True Range with Radial Basis Function kernel smoothing to dynamically analyze market volatility and detect trend changes across different assets.
The Shiller PE Ratio is a long-term market valuation indicator that measures stock prices relative to inflation-adjusted 10-year average earnings for the S&P 500.
A long-term investment strategy that triggers a buy signal when today's low is lower than yesterday's, with an automatic selling mechanism set at 100% profit above average buying price.
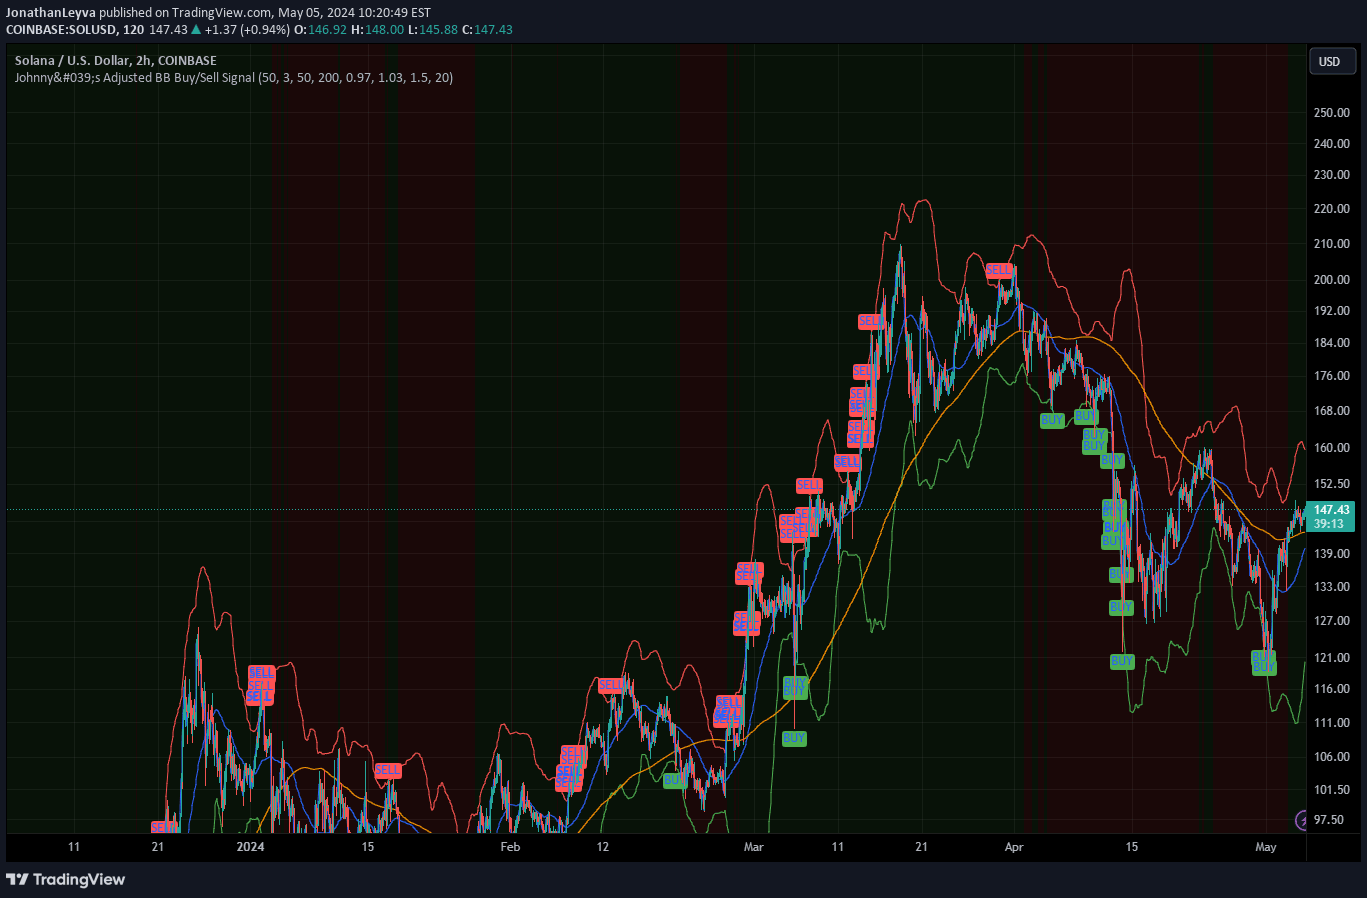
A dynamic trading signal using Bollinger Bands and moving averages to identify strategic entry and exit points by analyzing market volatility and trend conditions.
A trading signal using RSI that generates a buy condition after tracking specific market behavior and requiring multiple confirmation stages before triggering.
An index investing indicator that identifies strategic entry points for long-term investments by calculating percentage discounts from reference prices like all-time high or year start.
A dual-timeframe indicator that identifies significant price highs and lows across long and short-term periods, helping traders spot potential trend changes and breakout opportunities.
The Buffett Indicator compares total US stock market capitalization to GDP, revealing market valuation levels and potential over or undervaluation across different economic periods.
A comprehensive dashboard for evaluating company fundamentals across valuation, profitability, and solvency metrics using dynamic financial analysis and visual scoring.
A performance tracking indicator for long-term investors using dividend reinvestment, calculating yearly returns and visualizing portfolio growth through accumulated shares and investment value.
A method to extend historical gold price data by using USD cross-rates, enabling traders to analyze longer-term price trends across different currency pairs.
Likes, views, and comments are historical TradingView snapshots. They describe attention, not trading performance.