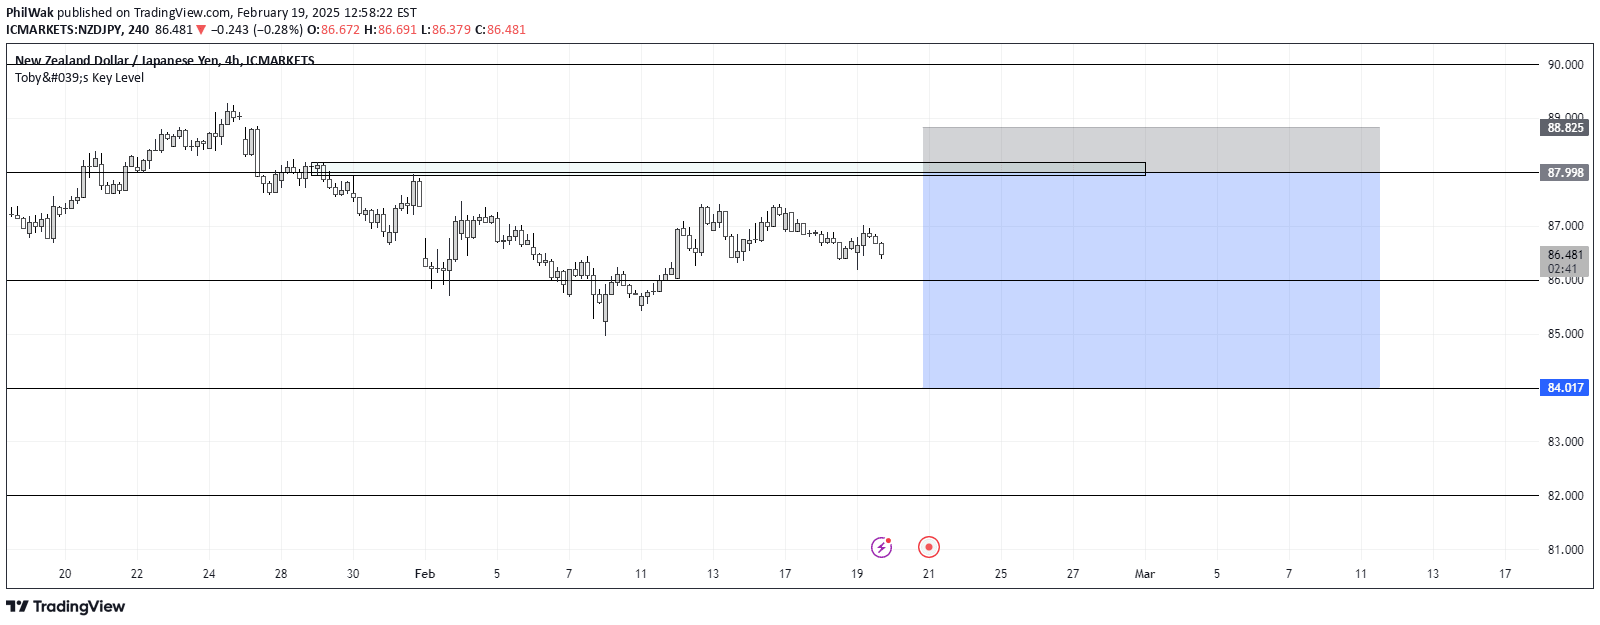
A fractal-based pivot analysis tool that identifies and grades pivot highs and lows across short, medium, and long-term timeframes to help traders understand market structure.
Explore complementary indicator rolesHow it works
The pivot signal works by analyzing price action across multiple timeframes using a configurable lookback period, typically 15 bars. It identifies pivot highs and lows by comparing surrounding price points and applying a 'spikeyness' filter to eliminate weak or rounded pivots.
The system categorizes pivots into short-term, medium-term, and long-term levels by evaluating their nested relationships. Short-term pivots are basic pivot points, medium-term pivots have lower short-term pivots on either side, and long-term pivots have lower medium-term pivots surrounding them.
Why it may be useful
The pivot signal provides traders with a visual and systematic way to understand market structure and price sensitivity across different timeframes. By grading pivots, traders can quickly assess the relative importance of price levels and identify key support and resistance zones.
This approach helps traders develop a more nuanced understanding of market dynamics, enabling more informed decision-making about potential entry and exit points. The flexible settings allow customization to suit different trading styles and asset classes.
When to explore it
The pivot signal is most effective when used in conjunction with other trading methods, particularly during periods of clear trend development or potential trend reversal. It works best on timeframes from 1-hour to daily charts, where the nested pivot structure becomes more apparent.
Traders should be patient, as longer-term pivots take more time to confirm and print. The signal is particularly useful for backtesting strategies, identifying significant price levels, and understanding the hierarchical structure of market movements across different timeframes.
Keep exploring
What we’ve verified
Access, alerts and repainting behaviour have not been independently verified for this indicator. Check the creator’s current publication and settings.
General descriptions and classifications are recovered research. Verified details above identify the specific checks we have completed. Check the creator’s current publication for later changes.