
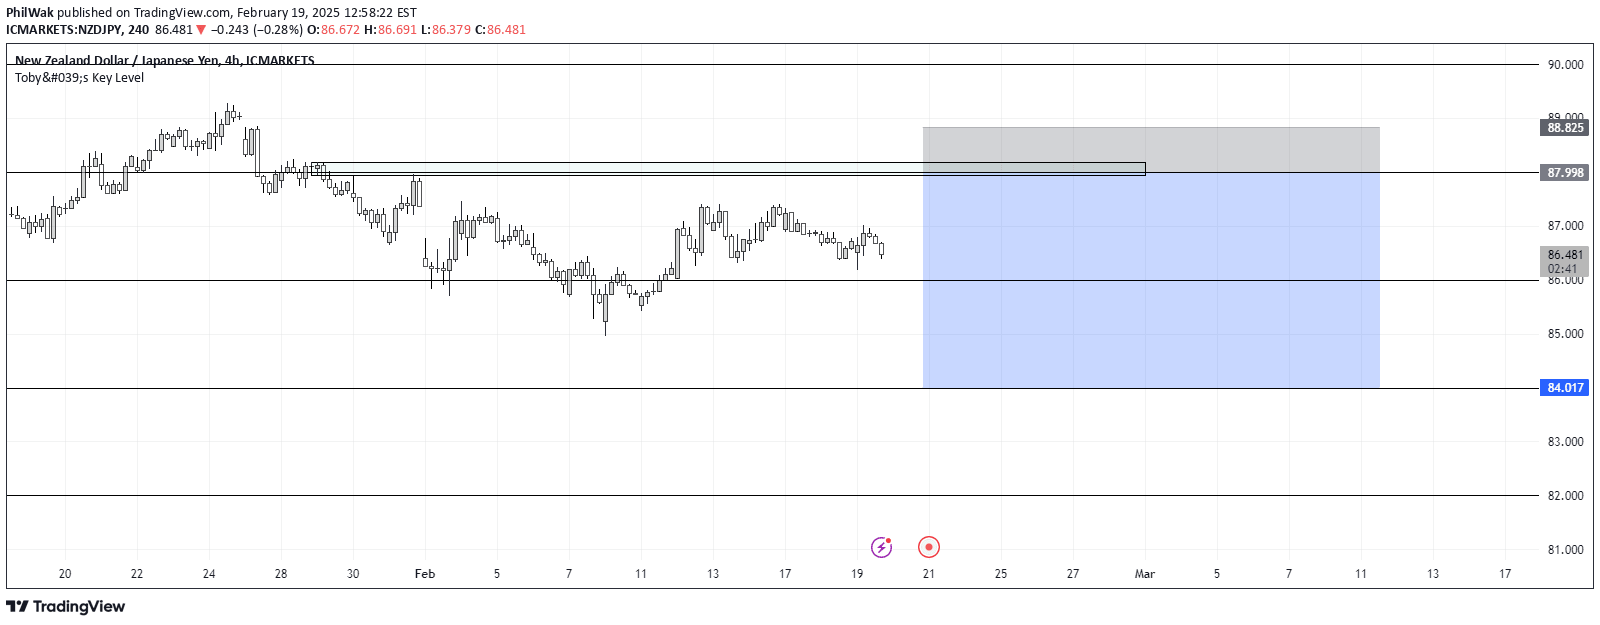
A trading tool that defines key horizontal lines for potential entry and exit points across different financial instruments, with customizable distance values for strategic trading.
Explore complementary indicator rolesHow it works
The indicator creates horizontal lines at specific, predetermined distances for various financial instruments like commodities, indices, and currency pairs. Traders can set these lines based on recommended values for each instrument type, such as 50 for XAU, 250 for NAS, or 100 for ETH.
By establishing these key areas, traders can visually mark potential support and resistance levels that can guide entry and exit decisions. The lines serve as strategic reference points, allowing traders to quickly identify potential trading opportunities and manage risk more effectively across different market contexts.
Why it may be useful
These key horizontal lines provide traders with a structured approach to identifying potential trading zones, reducing emotional decision-making and offering a systematic method for market analysis. By standardizing distance values for different instruments, traders can develop a consistent strategy that adapts to various market conditions.
The flexibility of the indicator allows traders to customize lines according to their trading style, making it a versatile tool for different trading approaches. This adaptability ensures that traders can fine-tune their strategy while maintaining a disciplined, methodical approach to market entry and exit points.
When to explore it
The indicator is most effective during periods of clear market trends and when trading instruments with consistent price movement characteristics. It works particularly well for day trading and swing trading strategies, where identifying key price levels can provide critical insights into potential market reversals or continuations.
Traders should use this tool in conjunction with other technical analysis methods to confirm signals and validate trading decisions. It is especially useful in markets with predictable volatility ranges, such as major currency pairs, commodities, and selected indices where historical price behavior can be more readily analyzed.
Keep exploring
What we’ve verified
Access, alerts and repainting behaviour have not been independently verified for this indicator. Check the creator’s current publication and settings.
General descriptions and classifications are recovered research. Verified details above identify the specific checks we have completed. Check the creator’s current publication for later changes.


