Bjorgum Key Levels
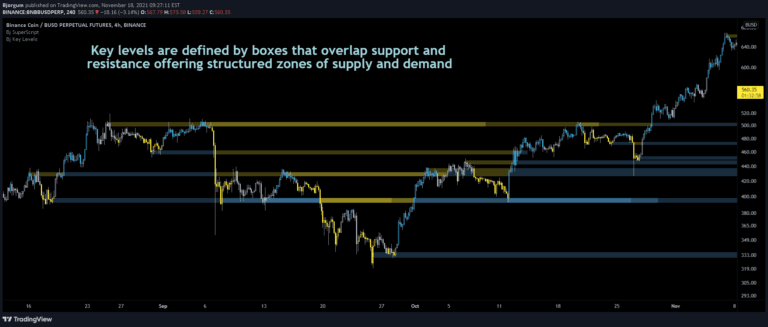
Key Levels strategy identifies critical price action points like breakouts, false breakouts, and backchecks to help traders understand market movement and potential trading opportunities.
Explore 11,183 indicators. Filter beyond the obvious.
Discover the tools that fit the way you trade.
11,183 tools to explore
Key Levels strategy identifies critical price action points like breakouts, false breakouts, and backchecks to help traders understand market movement and potential trading opportunities.
Advanced volume profile indicator that analyzes market order flow, helping traders understand buying and selling pressure across different timeframes using customizable visualization modes.
An AI-powered moving average indicator using KNN algorithm to analyze price data, providing dynamic trend recognition and market classification through intelligent pattern interpretation.
A trading strategy analyzing candlestick patterns using symmetry, baseline bound, and specific pattern recognition to identify potential market trend reversals and continuations.
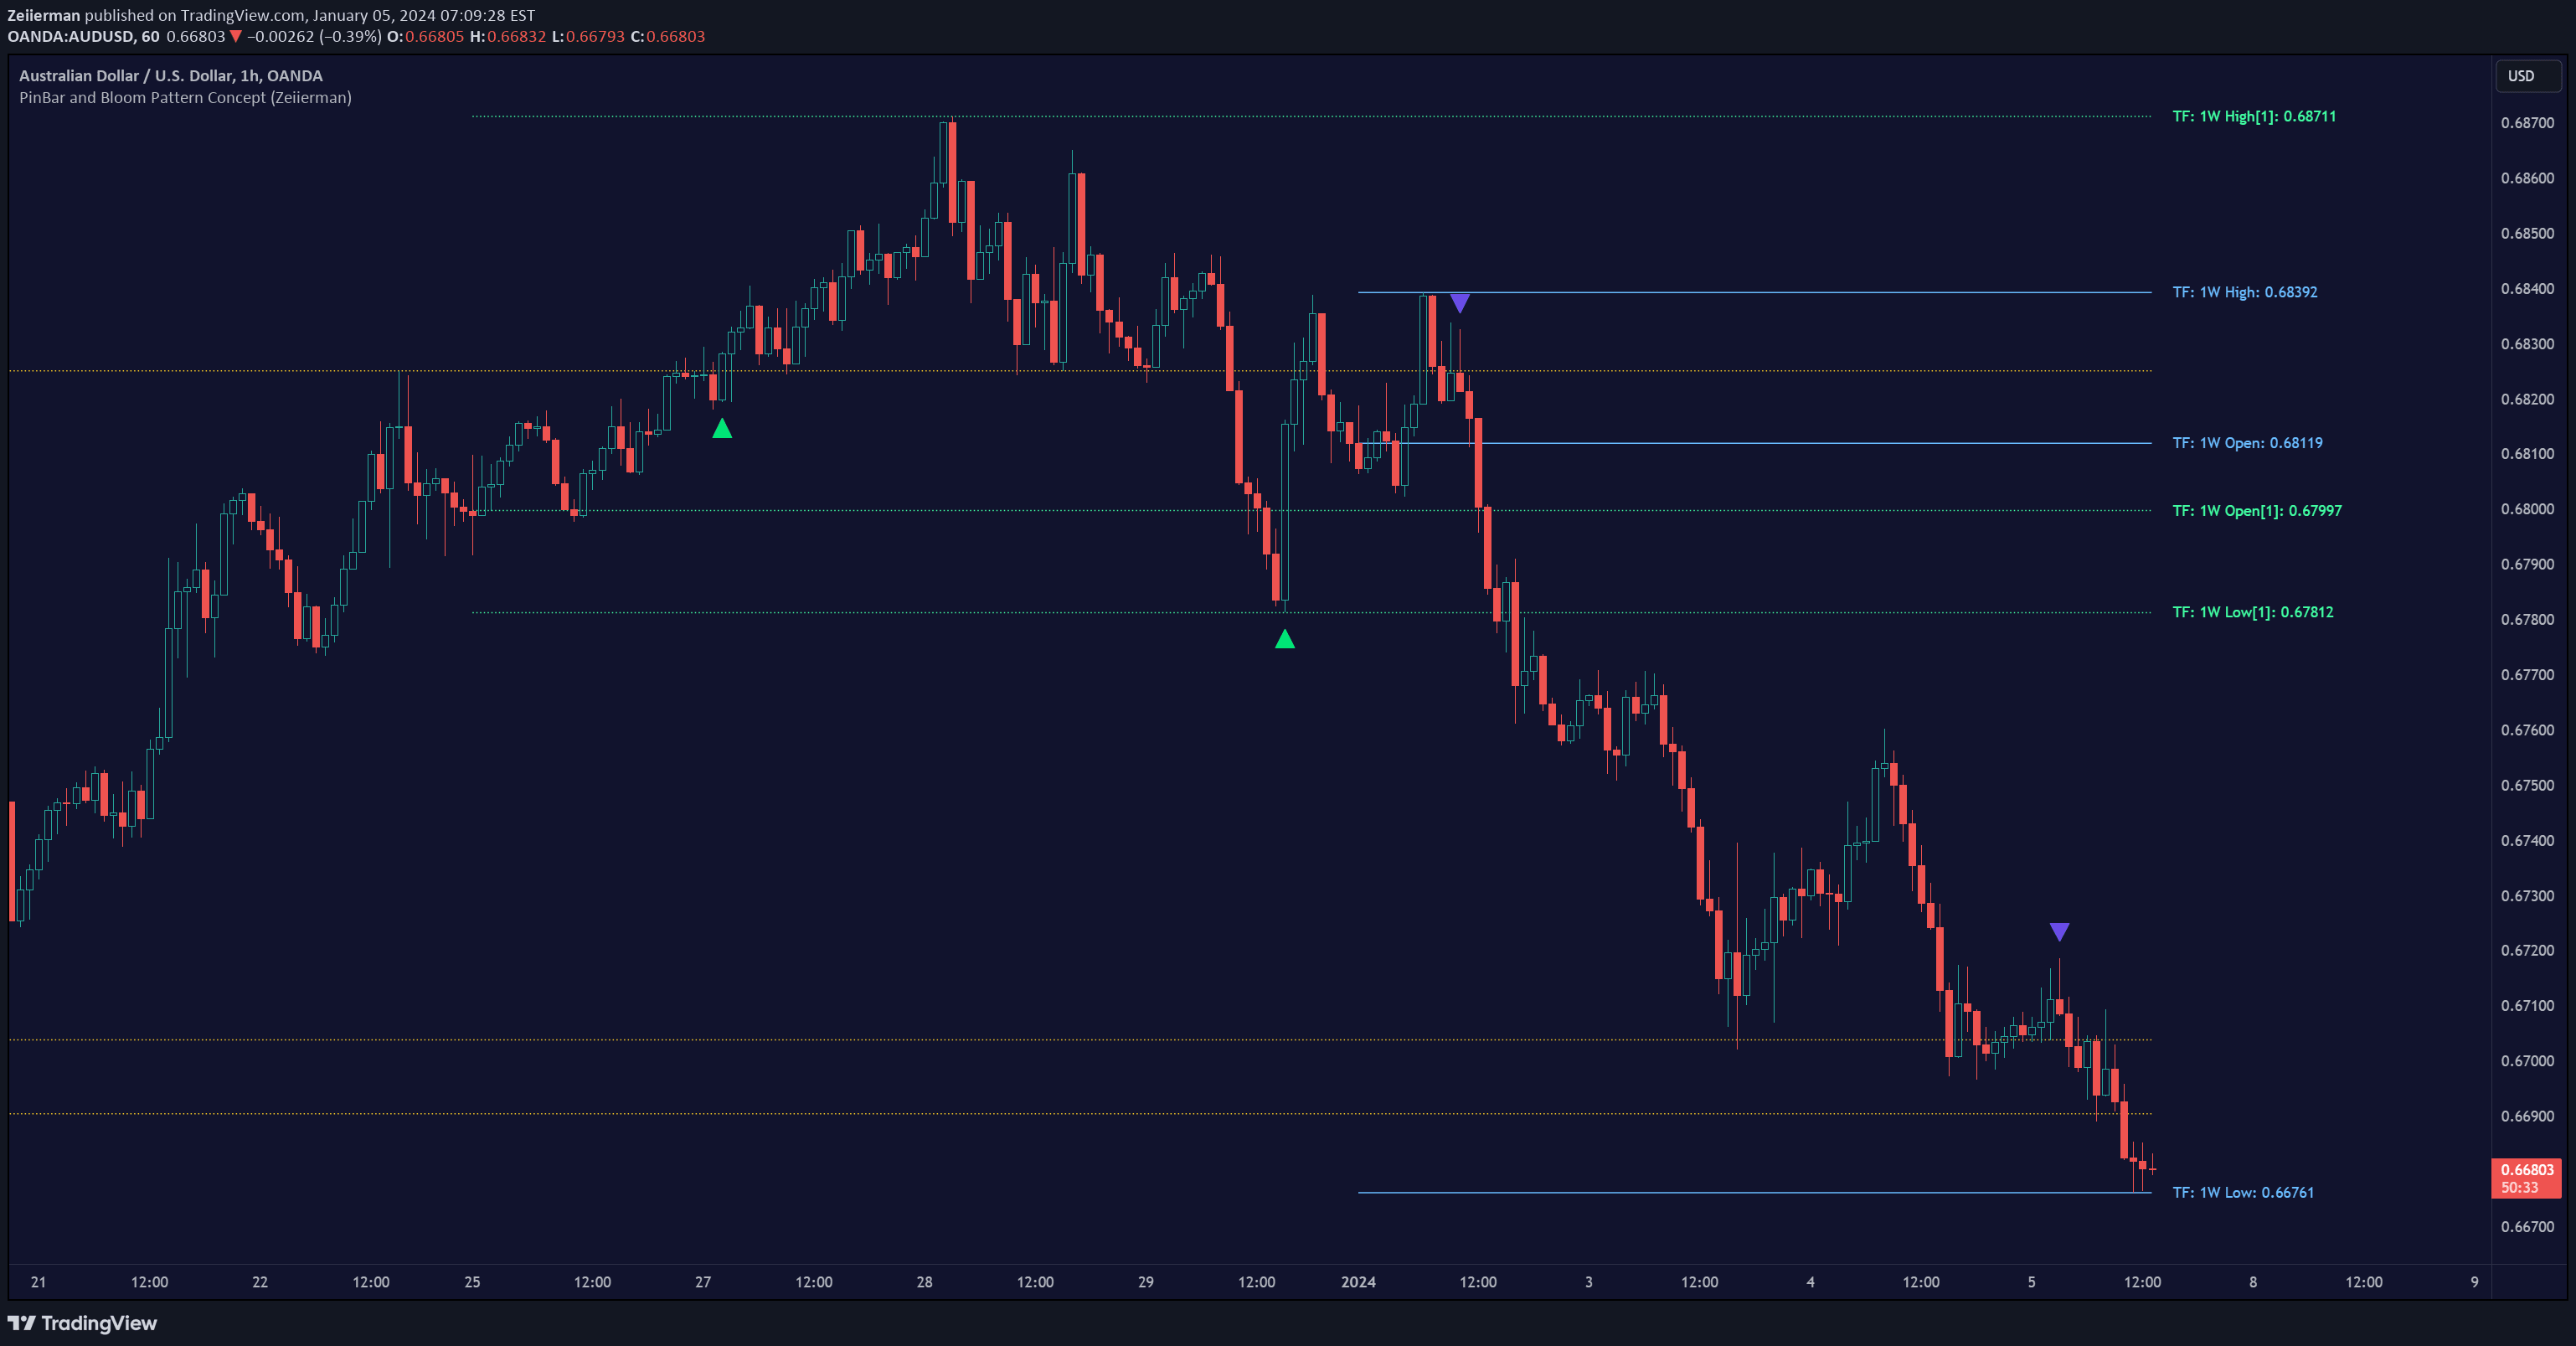
A customizable indicator that displays key market levels including daily, pre-market, and historical highs and lows to help traders identify potential support and resistance zones.
A custom zone indicator that identifies support and resistance levels based on previous day's and week's high and low prices, useful for trend reversals and breakout trading.
Dynamic Point of Control indicator that reveals market-dominant price levels using volume or price profiles, helping traders identify key support and resistance zones with customizable analysis.
A machine learning-powered indicator that dynamically identifies support and resistance levels using advanced clustering techniques to help traders spot potential market reversal points and key price zones.
A sophisticated trading indicator that reveals market liquidity dynamics by distinguishing between smart money and retail trading activities using advanced volume and index calculations.
The Gann Square of 9 is a technical analysis tool that helps traders identify potential support and resistance levels by mapping price movements on a geometric grid.
A versatile indicator that displays key trading levels with extensive customization options. Helps traders identify crucial price points and market structure with multiple display settings.
A multi-timeframe support and resistance indicator that helps traders identify key price levels across different timeframes for more comprehensive market analysis.
Likes, views, and comments are historical TradingView snapshots. They describe attention, not trading performance.