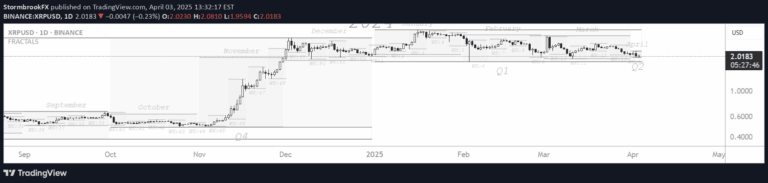
A trading strategy analyzing candlestick patterns using symmetry, baseline bound, and specific pattern recognition to identify potential market trend reversals and continuations.
Explore complementary indicator rolesHow it works
The Precision PinBar and Bloom Pattern Concept analyzes market data by examining relationships between consecutive candlesticks using advanced algorithmic techniques. It calculates symmetry between high and low prices, evaluates candlestick body relationships, and checks specific pattern conditions like embodying and baseline bound thresholds.
The system identifies unique patterns through precise measurements of tail lengths, body sizes, and positional characteristics. By comparing current and previous candle attributes, it generates bullish and bearish signals that help traders understand potential market movements and trend reversals.
Why it may be useful
These patterns provide traders with nuanced insights into market psychology and potential price movements by going beyond traditional candlestick analysis. The method offers a more sophisticated approach to understanding market dynamics, revealing subtle signals that might be missed by standard technical indicators.
By incorporating multiple analytical dimensions like symmetry, range thresholds, and precise candlestick measurements, traders can develop more robust and contextually aware trading strategies. The approach helps minimize false signals and provides a more comprehensive view of potential market transitions.
When to explore it
The Precision PinBar and Bloom Pattern Concept works best during periods of market transitions, particularly around key support and resistance levels. Traders should apply this strategy when seeking high-probability entry and exit points, especially during trending and ranging market conditions.
The method is particularly effective when combined with other technical analysis tools, helping confirm potential trade setups across various timeframes. Ideal scenarios include identifying potential reversals near significant price levels, detecting early trend changes, and providing additional confirmation for existing trading strategies.
Keep exploring
What we’ve verified
Access, alerts and repainting behaviour have not been independently verified for this indicator. Check the creator’s current publication and settings.
General descriptions and classifications are recovered research. Verified details above identify the specific checks we have completed. Check the creator’s current publication for later changes.