
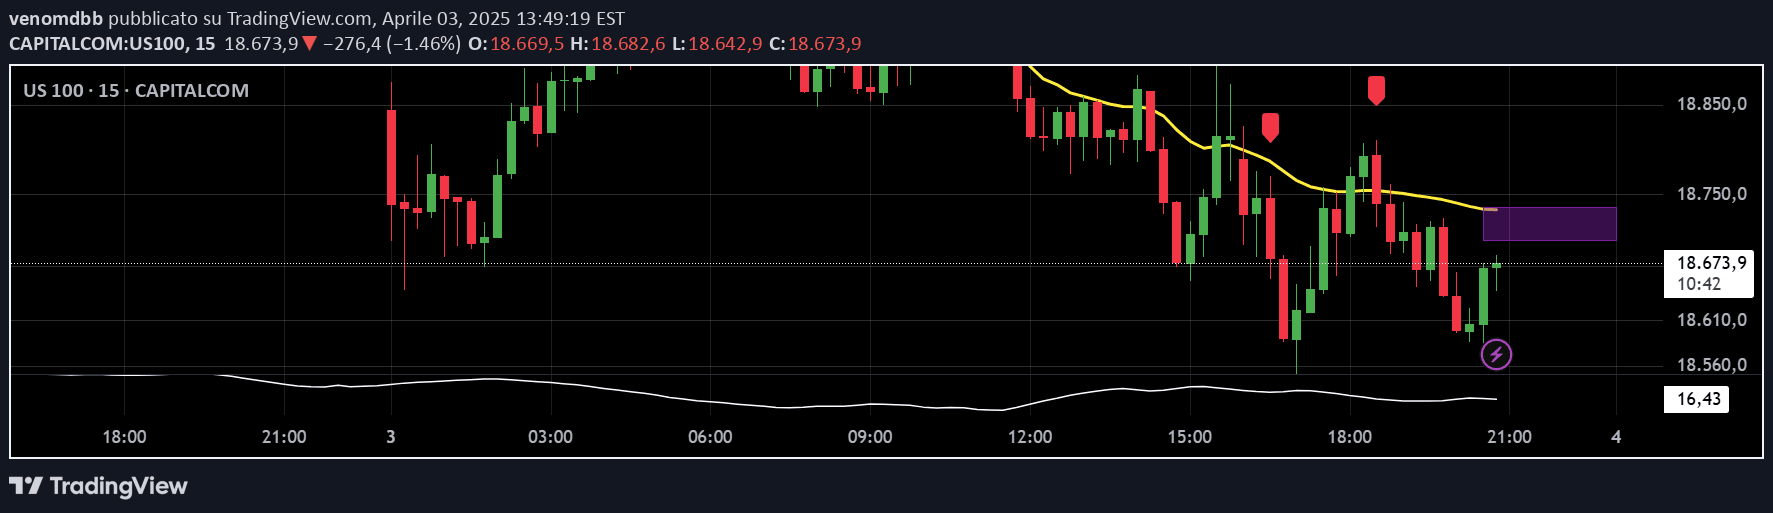
A custom indicator identifying Bullish and Bearish Engulfing Candles as potential trend reversal signals, using price action and Average True Range (ATR) to validate candlestick patterns.
Explore complementary indicator rolesHow it works
The Engulfing Candle Indicator analyzes consecutive candlesticks to identify potential trend reversals by comparing their body sizes and relationships. It specifically looks for scenarios where a smaller bearish candle is completely engulfed by a subsequent larger bullish candle, or vice versa, indicating a potential shift in market sentiment.
The script incorporates an Average True Range (ATR) filter to ensure the engulfing candles have sufficient size relative to market volatility. This additional validation helps prevent false signals by confirming that the price movement is significant enough to potentially represent a meaningful trend change.
Why it may be useful
Engulfing candle patterns provide traders with visual representations of potential market sentiment shifts and trend reversals. By identifying moments where buying or selling pressure dramatically overwhelms the previous candle's direction, traders can gain insights into potential entry and exit points with clear, observable price action signals.
The inclusion of ATR filtering adds an extra layer of reliability by ensuring that the pattern represents a substantial market movement rather than minor price fluctuations. This approach helps traders filter out noise and focus on more meaningful potential trading opportunities.
When to explore it
The Engulfing Candle Indicator works best in markets with clear trending or ranging conditions, where price action patterns can provide meaningful insights into potential trend reversals. It is particularly effective in liquid markets with sufficient price volatility, such as major forex pairs, stock indices, and actively traded commodities.
Traders should ideally use this indicator in conjunction with other technical analysis tools and confirmation signals to increase the probability of successful trades. It is most suitable for short to medium-term trading strategies, especially in timeframes ranging from 1-minute to daily charts.
Keep exploring
What we’ve verified
Access, alerts and repainting behaviour have not been independently verified for this indicator. Check the creator’s current publication and settings.
General descriptions and classifications are recovered research. Verified details above identify the specific checks we have completed. Check the creator’s current publication for later changes.


