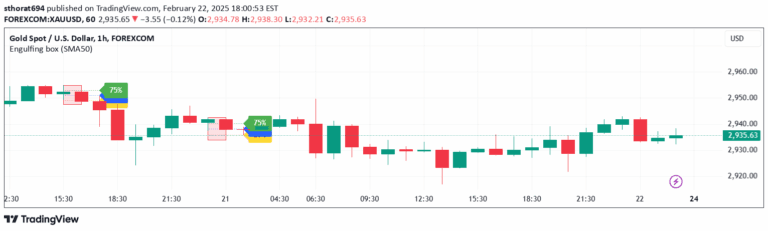
A technical indicator that identifies Engulfing candlestick patterns relative to the 200 EMA, highlighting potential trend reversals and providing visual cues for trading decisions.
Explore complementary indicator rolesHow it works
The Engulfing Box & Lines indicator operates by analyzing consecutive candlesticks to detect specific engulfing patterns that signal potential trend reversals. It specifically looks for bullish and bearish engulfing candles where one candle completely encompasses the body of the previous candle, indicating a potential shift in market momentum.
The indicator uses the 200-period Exponential Moving Average (EMA) as a reference point, color-coding the engulfing patterns based on their relationship to the long-term trend. Green boxes are used for bullish engulfing patterns when price is above the 200 EMA, while red boxes represent bearish engulfing patterns when price is below the 200 EMA, providing traders with a visual representation of potential trend changes.
Why it may be useful
The Engulfing Box & Lines indicator is crucial for traders because it provides a clear, visual method of identifying potential trend reversals and market sentiment shifts. By highlighting key candlestick patterns, the indicator helps traders recognize moments when buying or selling pressure might be changing, potentially offering early warning signs of trend transitions.
Moreover, the indicator's use of the 200 EMA adds an additional layer of context, helping traders understand these patterns within the broader market trend. The colored boxes and horizontal lines make it easier for traders to quickly assess market conditions, potentially improving decision-making and reducing the complexity of technical analysis.
When to explore it
The Engulfing Box & Lines indicator is most effective in trending markets where clear directional movement is present. Traders can use this indicator during periods of established trends to identify potential continuation or reversal signals, particularly when combined with other technical analysis tools and confirmation indicators.
It works best when applied to timeframes that allow for sufficient candlestick formation and trend development, such as daily, 4-hour, or 1-hour charts. Traders should be especially attentive to these signals during key market sessions, economic announcements, or when price is approaching significant support and resistance levels.
Keep exploring
What we’ve verified
Access, alerts and repainting behaviour have not been independently verified for this indicator. Check the creator’s current publication and settings.
General descriptions and classifications are recovered research. Verified details above identify the specific checks we have completed. Check the creator’s current publication for later changes.