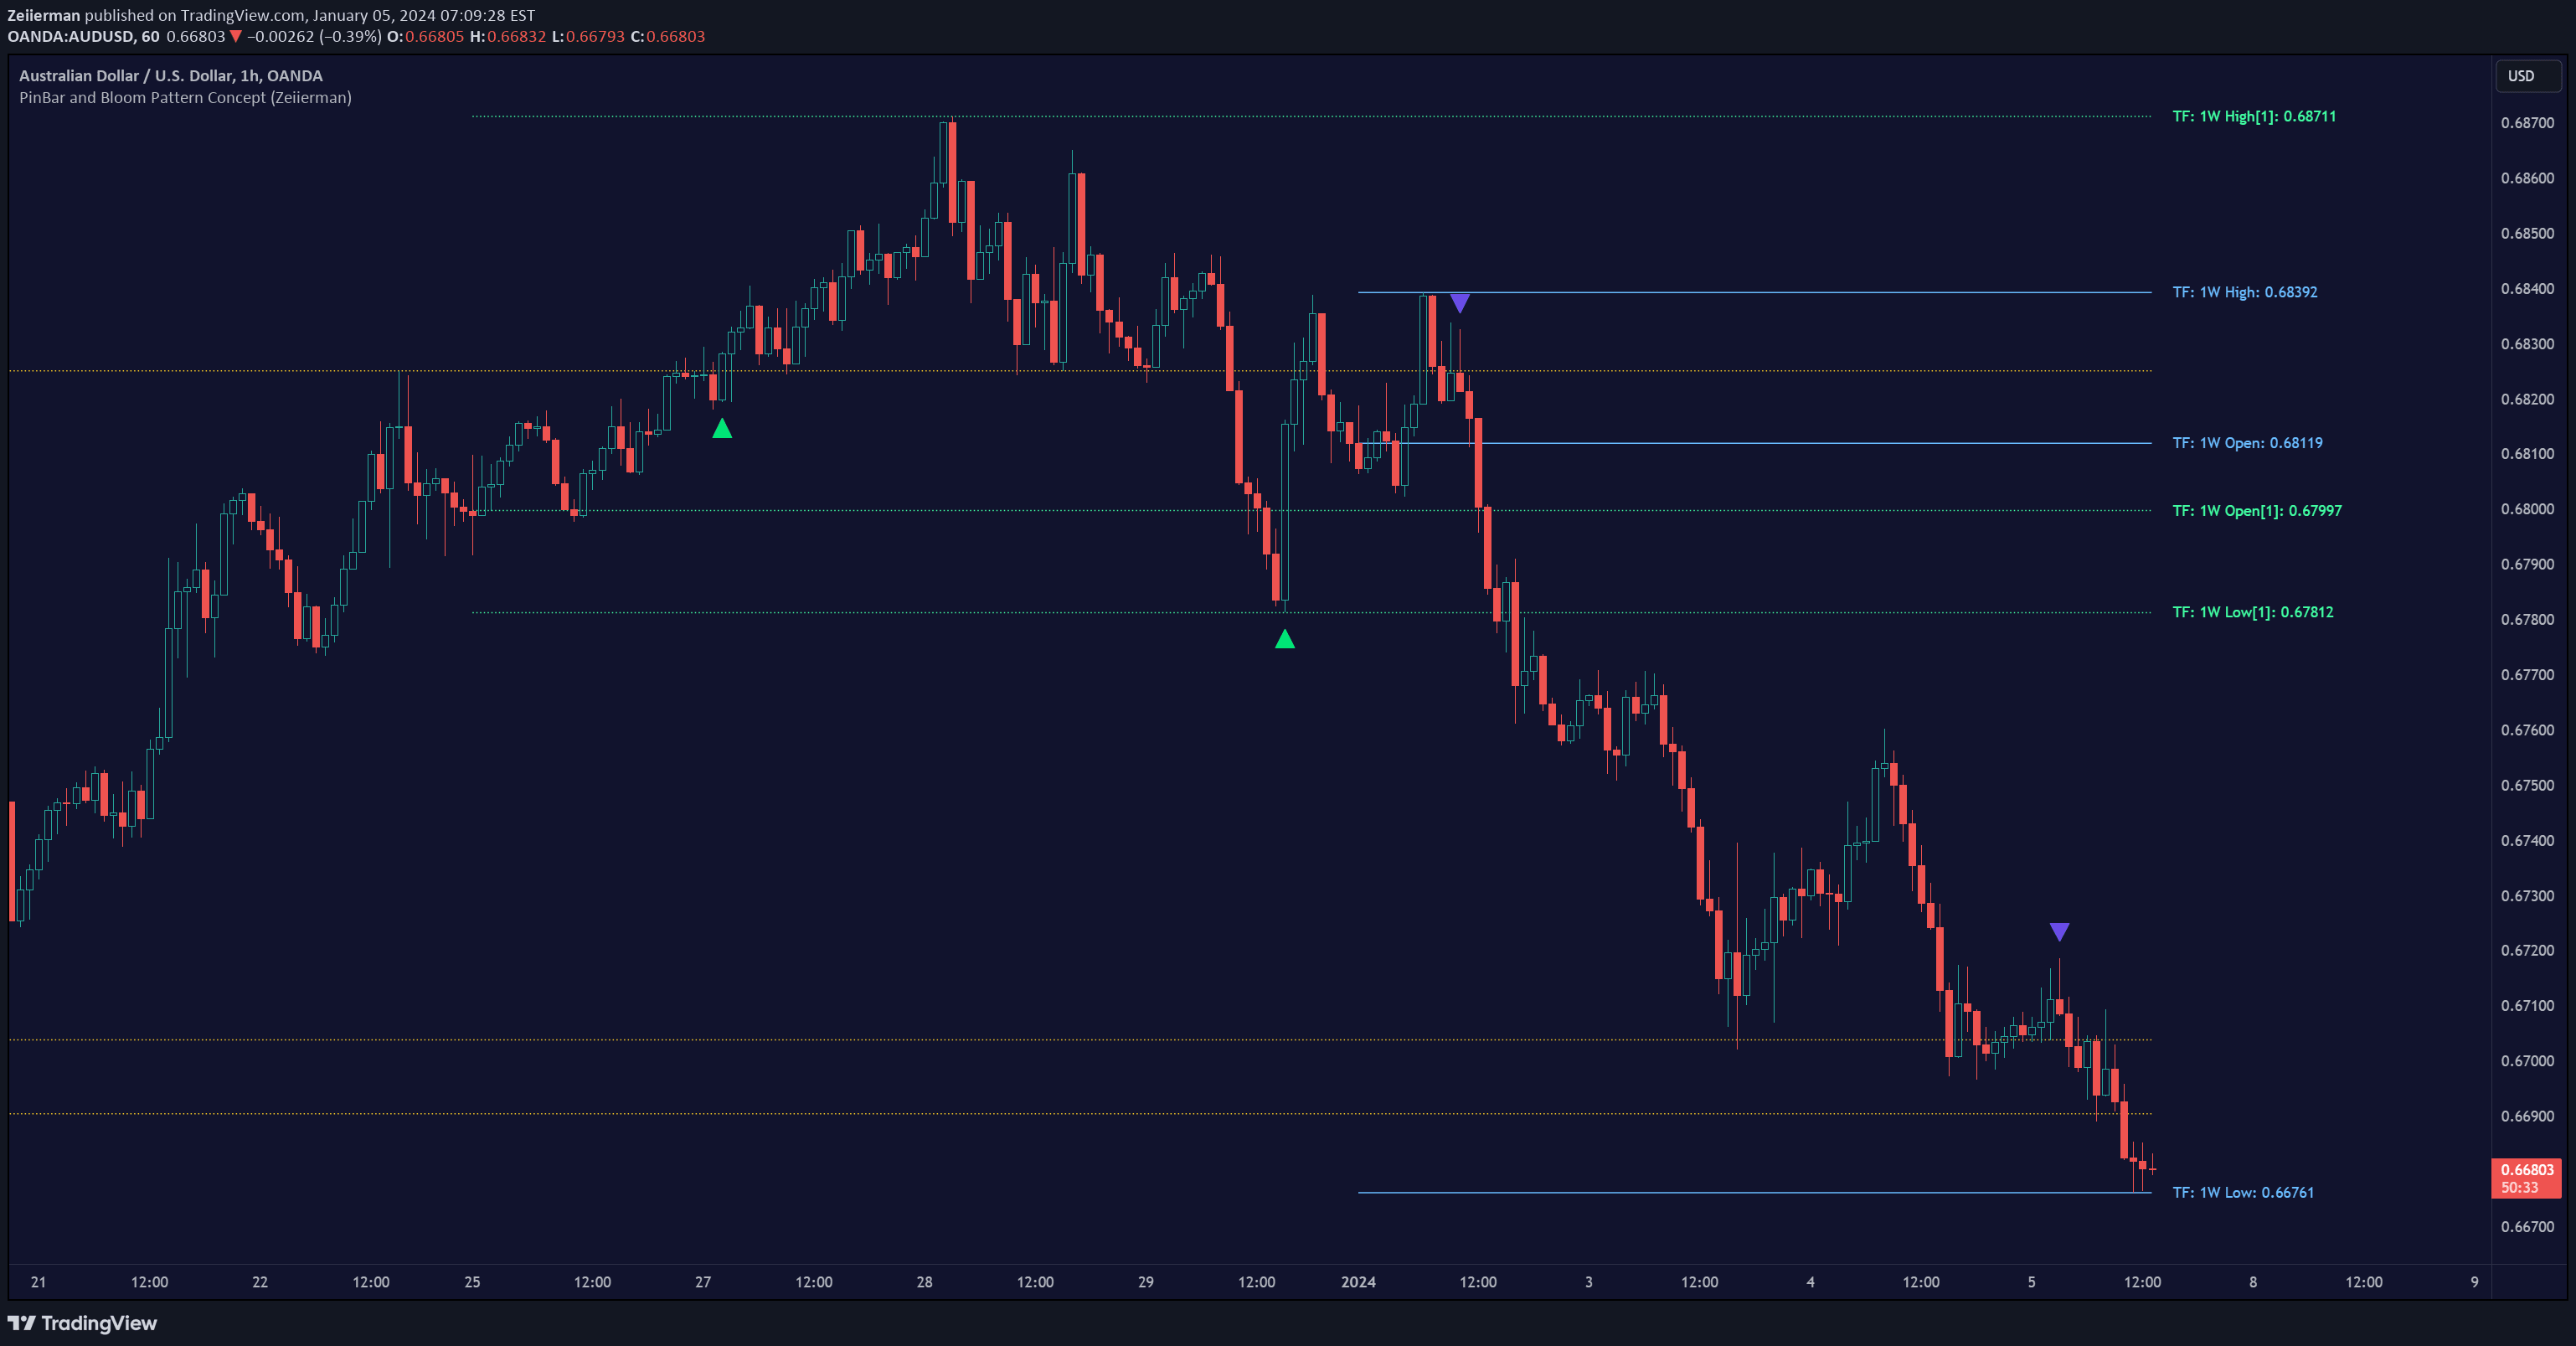
PinBar and Bloom Pattern Concept (Zeiierman)
A trading strategy analyzing candlestick patterns using symmetry, baseline bound, and specific pattern recognition to identify potential market trend reversals and continuations.
Explore 11,183 indicators. Filter beyond the obvious.
Discover the tools that fit the way you trade.
11,183 tools to explore
A trading strategy analyzing candlestick patterns using symmetry, baseline bound, and specific pattern recognition to identify potential market trend reversals and continuations.
AutoFibGauge is an advanced trading indicator that automatically plots Fibonacci retracement levels, confirms trends with moving averages, and provides a visual thermometer for quick market opportunity identification.
A comprehensive multi-timeframe trend analysis dashboard that combines multiple technical indicators to provide traders with a clear, concise view of market direction across different time periods.
The Quantum Moving Average is an advanced multi-timeframe moving average indicator that dynamically analyzes market trends by integrating four different timeframes with adaptive weighting.
A volume-weighted technical indicator that measures market momentum by analyzing the relationship between price movements and trading volumes, providing insights into trend strength and potential reversals.
Quantum RSI is an advanced momentum oscillator using Gaussian decay to measure price changes more precisely, offering enhanced trend detection with intuitive color-coded visualization.
A proxy implementation of the Bloomberg Financial Conditions Index that assesses market stress by aggregating six key financial market components into a single standardized measure.
Quantum Motion Oscillator (QMO) is an advanced momentum indicator that uses multi-timeframe linear regression and EMA crossovers to analyze market dynamics and predict potential trend shifts.
Entropy Bands are advanced volatility indicators that use entropy theory and adaptive moving averages to analyze market behavior, providing dynamic insights into trend strength and potential breakouts.
Parabolic SAR is a trend-following indicator that helps traders identify market direction and potential trend reversals by plotting dots above or below price candles.
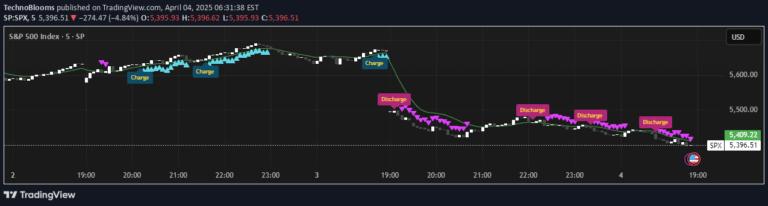
A quantum-inspired trading indicator that uses physics principles to detect market energy shifts, identifying trend momentum through entropy, volatility, and price acceleration analysis.
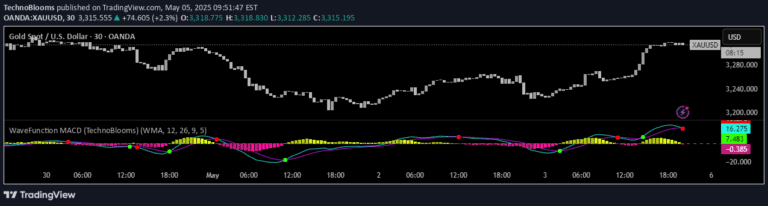
WaveFunction MACD is an advanced momentum indicator combining classical MACD logic with wave physics and quantum mechanics principles to analyze market energy and trend dynamics.
Likes, views, and comments are historical TradingView snapshots. They describe attention, not trading performance.