A quantum-inspired trading indicator that uses physics principles to detect market energy shifts, identifying trend momentum through entropy, volatility, and price acceleration analysis.
Explore complementary indicator rolesHow it works
The Momentum Charge Theory (MCT) Indicator operates by integrating advanced scientific principles to analyze market dynamics. It breaks down price movement into energy-based components, measuring directional market entropy, information flow volatility, and kinetic energy momentum.
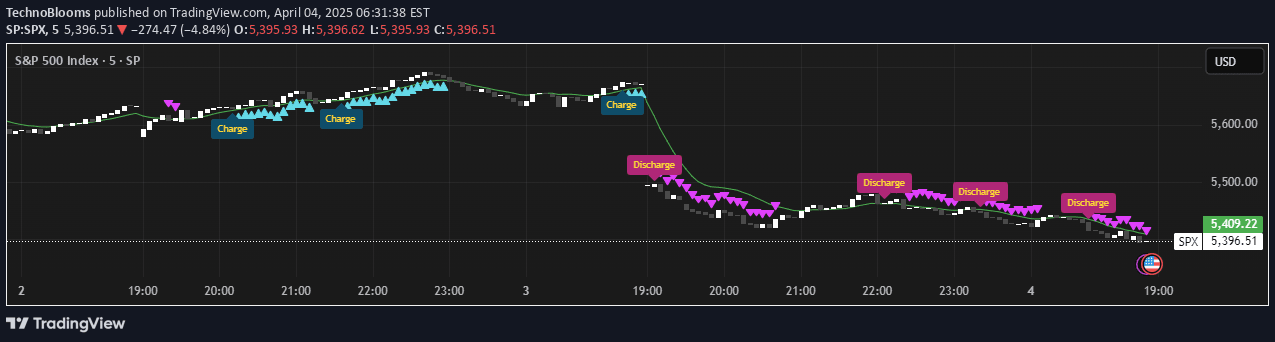
The system applies complex mathematical transforms like Hilbert and wavelet analysis to filter out market noise and detect precise trend shifts. By converting price action into an energy system, MCT identifies momentum buildup and potential trend reversals through charge and discharge signals represented by color-coded triangles.
Why it may be useful
The MCT Indicator provides traders with a sophisticated, scientifically-grounded approach to understanding market movements beyond traditional technical analysis methods. By incorporating principles from physics and quantum mechanics, it offers a more nuanced view of market dynamics that goes beyond simple price tracking.
This approach allows traders to detect potential trend changes earlier and with greater precision, reducing the likelihood of false signals and providing a more robust framework for making trading decisions across different market conditions and timeframes.
When to explore it
The MCT Indicator is most effective in markets with clear directional movements and meaningful momentum shifts, such as forex, stocks, and cryptocurrency trading. It performs exceptionally well during periods of distinct trend formation and when markets are experiencing significant directional changes.
Traders should ideally use this indicator in conjunction with other technical analysis tools to confirm signals and validate potential trade entries and exits. It is particularly powerful for momentum traders, breakout specialists, and trend followers seeking a more advanced analytical approach to market analysis.
Keep exploring
What we’ve verified
Access, alerts and repainting behaviour have not been independently verified for this indicator. Check the creator’s current publication and settings.
General descriptions and classifications are recovered research. Verified details above identify the specific checks we have completed. Check the creator’s current publication for later changes.