A multi-timeframe Zigzag indicator that plots swing points across three timeframes, providing comprehensive trend analysis with integrated technical indicator values.
Explore complementary indicator rolesHow it works
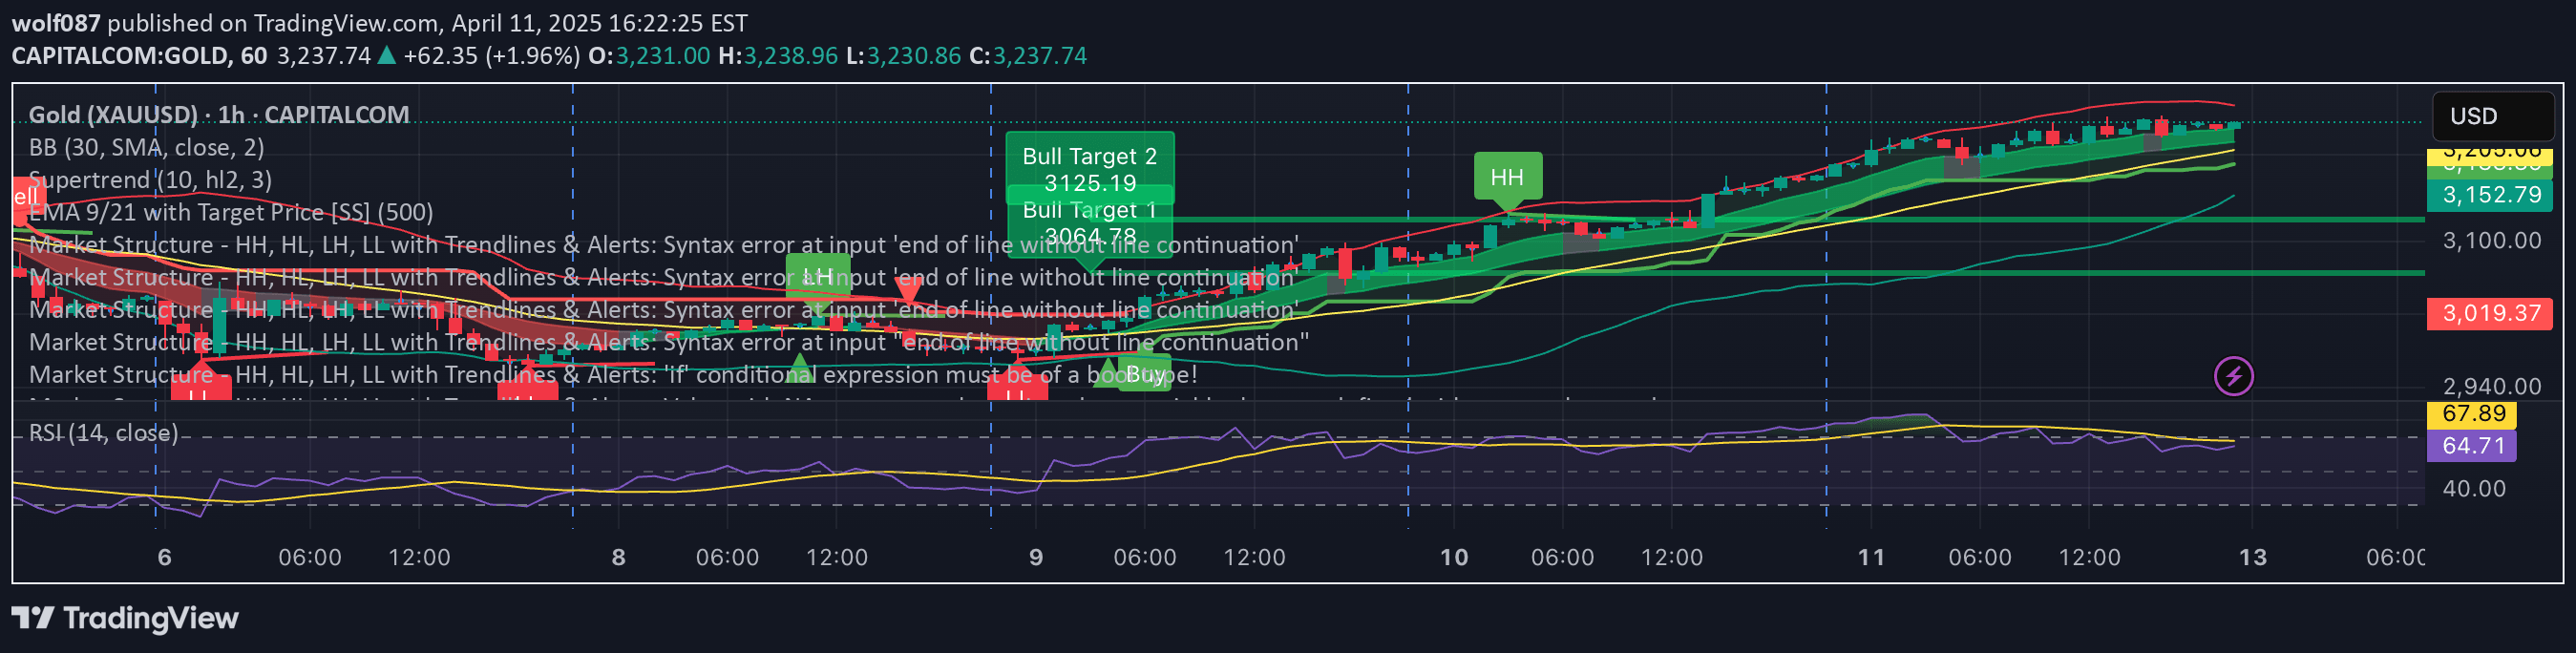
The MTF Zigzag indicator analyzes price movements across three different timeframes by marking significant swing points and labeling them as HH (Higher High), LL (Lower Low), HL (Higher Low), and LH (Lower High). It automatically draws Zigzag lines on the chart timeframe and two additional higher timeframes, allowing traders to identify trend dynamics and potential support/resistance levels.
Each swing point is enhanced with a tooltip that displays detailed information, including the swing type, bar time, price change percentage, swing volume, and key technical indicator values such as RSI, Stochastic, ADX, and multiple Simple Moving Averages (SMA).
Why it may be useful
This multi-timeframe Zigzag indicator provides traders with a comprehensive view of market trends by simultaneously analyzing price movements across different timeframes. It simplifies complex trend identification by visualizing swing points and integrating multiple technical indicators, enabling traders to make more informed trading decisions.
The indicator's unique approach allows traders to understand trend strength, momentum, and potential reversal points by comparing technical indicator values across different timeframes. This holistic perspective helps traders develop more robust trading strategies and improve their market analysis capabilities.
When to explore it
The MTF Zigzag indicator is most effective when traders want to gain a comprehensive understanding of market trends across multiple timeframes. It is particularly useful during periods of market uncertainty, when traders need to assess trend strength and potential support/resistance levels from different perspectives.
Traders can leverage this indicator for trend identification, trade entry and exit strategies, and confirming trading signals by comparing technical indicator values across different timeframes. It is especially valuable for traders who want to develop multi-timeframe trading strategies and gain deeper insights into market dynamics.
Keep exploring
What we’ve verified
Access, alerts and repainting behaviour have not been independently verified for this indicator. Check the creator’s current publication and settings.
General descriptions and classifications are recovered research. Verified details above identify the specific checks we have completed. Check the creator’s current publication for later changes.