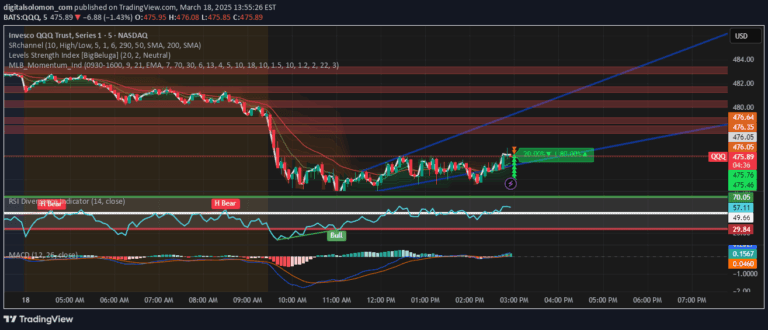
A trading signal that uses Rate of Change and percentile analysis to generate buy and sell signals based on momentum, price position, and average percentile levels.
Explore complementary indicator rolesHow it works
The signal calculates the Rate of Change (ROC) of closing prices over a specified momentum period to assess price momentum. It then computes two key percentiles: the 80th percentile of high prices and the 20th percentile of low prices, creating an average percentile level.
When the ROC is positive and the closing price is above both the lower percentile and average percentile, a buy signal is generated. Conversely, when the ROC is negative and the closing price is below the upper percentile and average percentile, a sell signal is triggered.
Why it may be useful
This signal provides traders with a dynamic method to assess market momentum and potential trend reversals by combining price rate of change with percentile-based analysis. It offers a systematic approach to identifying potential entry and exit points based on objective, quantitative criteria.
By integrating multiple analytical components, the signal helps traders make more informed decisions, reducing emotional trading and providing a structured framework for identifying market opportunities across different trading timeframes.
When to explore it
The signal is most effective in markets with clear, trending price movements and moderate volatility. It works best when price momentum is consistent and percentile ranges provide meaningful insights into market behavior.
Traders should consider using this signal in liquid markets with sufficient price history to generate reliable percentile calculations. It is particularly useful for short to medium-term trading strategies that aim to capture momentum-driven price movements.
Keep exploring
What we’ve verified
Access, alerts and repainting behaviour have not been independently verified for this indicator. Check the creator’s current publication and settings.
General descriptions and classifications are recovered research. Verified details above identify the specific checks we have completed. Check the creator’s current publication for later changes.