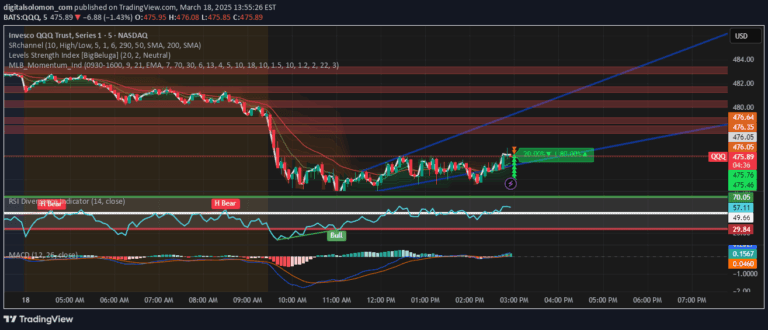
A custom momentum indicator that identifies potential buy and sell signals by analyzing price changes, volume, and recent price action to determine trend strength and direction.
Explore complementary indicator rolesHow it works
The Swinging Momentum indicator evaluates price momentum by examining the rate of change in closing prices over recent bars. It first identifies initial buy or sell signals by looking at price momentum, comparing current closes to recent highs and lows, and analyzing trading volume.
The indicator then grades the signal strength on a 0-3 scale by checking specific conditions. For buy signals, it considers factors like close price relative to recent bars, current low position, and recent gaining days. For sell signals, it examines close price comparison, current high position, and recent losing days to refine the momentum assessment.
Why it may be useful
Momentum indicators help traders understand the speed and strength of price movements, providing insights into potential trend continuations or reversals. By combining multiple momentum strategies, this indicator offers a more comprehensive view of market dynamics, helping traders make more informed decisions.
The strength rating system allows traders to filter out weaker signals and focus on higher-probability trade setups. This approach reduces false signals and helps traders identify more reliable entry and exit points, ultimately improving trading strategy and risk management.
When to explore it
The Swinging Momentum indicator works best in trending markets with clear directional movement and sufficient trading volume. It is particularly effective when used in conjunction with other technical indicators that can confirm momentum signals and provide additional market context.
Traders should apply this indicator during periods of sustained price movement, such as during strong bullish or bearish trends, breakouts, or when significant market events are driving price action. It is most reliable when combined with comprehensive market analysis and robust risk management strategies.
Keep exploring
What we’ve verified
Access, alerts and repainting behaviour have not been independently verified for this indicator. Check the creator’s current publication and settings.
General descriptions and classifications are recovered research. Verified details above identify the specific checks we have completed. Check the creator’s current publication for later changes.