
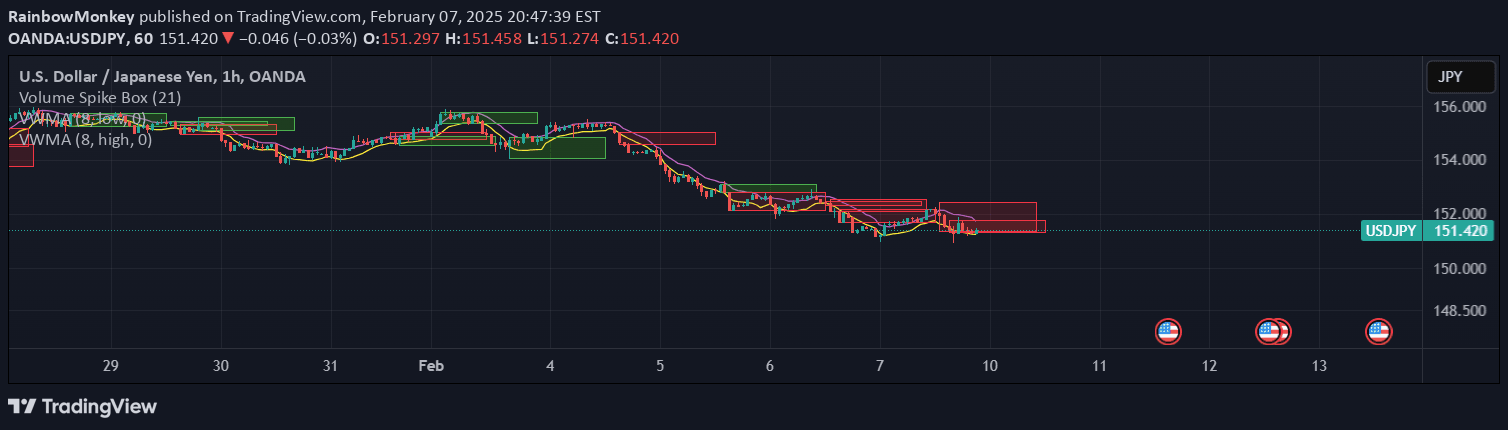
A volume-based indicator that identifies the highest volume candlestick within a specified number of bars, extending potential support and resistance zones for trading analysis.
Explore complementary indicator rolesHow it works
The indicator scans a specified number of historical bars to identify the candlestick with the highest trading volume during that period. It then marks this high-volume candlestick and extends its potential significance by projecting support and resistance levels for the same duration into the future. This process involves analyzing the volume data of each candlestick and comparing their relative trading volumes to determine the most significant bar.
By highlighting the highest volume bar, the indicator helps traders understand which price points have attracted the most market participation and trading interest. The extension of these levels provides traders with a visual representation of potential key price zones where market participants might show increased activity or where price movements might encounter resistance or support.
Why it may be useful
Volume is a critical indicator of market sentiment and potential price movements, making this signal valuable for understanding market dynamics. By identifying the highest volume candlestick, traders can gain insights into periods of significant market activity and potential trend reversals or continuations. This information helps traders make more informed decisions about entry and exit points, as high-volume bars often indicate moments of substantial market consensus.
The extended support and resistance projections offer traders a strategic tool for anticipating potential price reactions. These zones can help traders identify areas where price might pause, reverse, or break through, providing a framework for setting stop-loss levels, determining potential take-profit points, and managing overall trade risk more effectively.
When to explore it
This indicator is most effective in markets with clear volume data and during periods of significant price movements. It works particularly well in liquid markets such as major stock indices, forex pairs, and high-volume commodities where trading activity is robust and consistent. Traders can use this signal to identify key market turning points, confirm trend strengths, and validate potential breakout or breakdown scenarios.
The signal is especially useful during market events, earnings releases, economic announcements, and other periods of heightened trading activity. Traders should combine this indicator with other technical analysis tools to validate signals and reduce false positives. It is particularly valuable for traders who prioritize volume-based analysis and seek to understand the underlying market sentiment behind price movements.
Keep exploring
What we’ve verified
Access, alerts and repainting behaviour have not been independently verified for this indicator. Check the creator’s current publication and settings.
General descriptions and classifications are recovered research. Verified details above identify the specific checks we have completed. Check the creator’s current publication for later changes.


