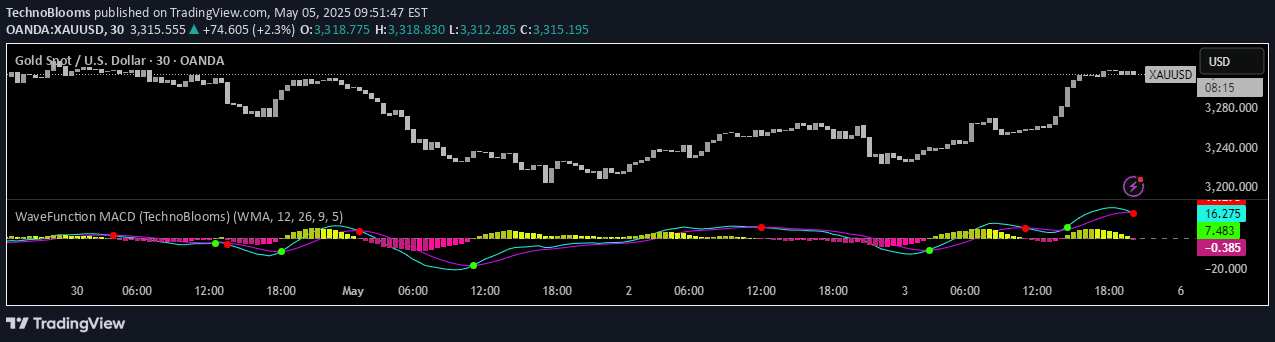
WaveFunction MACD is an advanced momentum indicator combining classical MACD logic with wave physics and quantum mechanics principles to analyze market energy and trend dynamics.
Explore complementary indicator rolesHow it works
The WaveFunction MACD operates by integrating Hilbert Transform techniques with cosine phase energy calculations to analyze price movements as probabilistic wave functions. It transforms traditional momentum analysis by computing phase-corrected momentum through the cosine of wave phase angles, revealing underlying market energy dynamics.
By leveraging quantum mechanical and signal processing principles, the indicator generates a sophisticated momentum map that goes beyond simple moving average crossovers. It uses wave physics to detect subtle trend shifts and momentum changes, creating a more nuanced view of market behavior that captures both directional movement and energetic intensity.
Why it may be useful
The WaveFunction MACD provides traders with a scientifically grounded approach to understanding market momentum, offering insights that traditional indicators often miss. By treating price action as an energy wave, it reveals the underlying forces driving market movements, allowing traders to anticipate potential trend changes with greater precision.
Its advanced algorithm combines multiple analytical techniques, including Hilbert Transform and quantum modeling, to create a robust tool for trend analysis. Traders benefit from its ability to smooth out market noise, detect early reversal signals, and provide a more comprehensive view of market dynamics beyond simple price tracking.
When to explore it
The WaveFunction MACD is most effective in markets with clear cyclical behaviors and when seeking to identify both emerging trends and potential trend reversals. It excels in environments where traditional momentum indicators might generate false signals, providing a more nuanced interpretation of market energy and direction.
Traders should utilize this indicator across various timeframes, from short-term scalping to longer-term swing trading, as its wave-based approach can reveal underlying market dynamics that other indicators might overlook. It is particularly valuable when used in conjunction with other technical analysis tools like liquidity zones, price action, and order block strategies.
Keep exploring
What we’ve verified
Access, alerts and repainting behaviour have not been independently verified for this indicator. Check the creator’s current publication and settings.
General descriptions and classifications are recovered research. Verified details above identify the specific checks we have completed. Check the creator’s current publication for later changes.