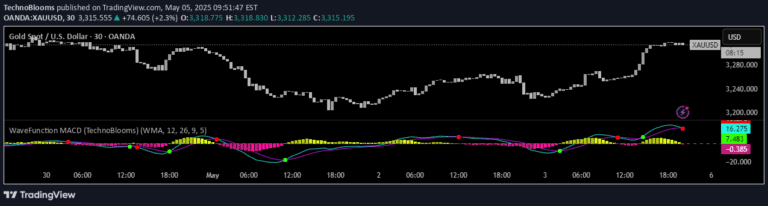
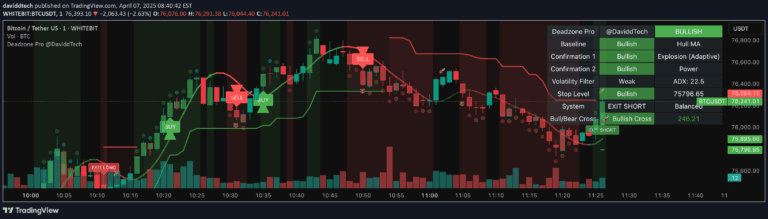
Tracks the collective percentage change of seven major tech stocks, providing real-time market insights through average performance, moving averages, and trend angle calculations.
Explore complementary indicator rolesHow it works
The indicator calculates the daily percentage change for each of the seven 'Magnificent 7' tech stocks, including Apple, Microsoft, Amazon, NVIDIA, Tesla, Meta, and Alphabet. It then computes the average percentage change across these stocks to provide a comprehensive view of their collective market performance.
Using a selected moving average type (SMA, EMA, WMA, or VWMA), the indicator smooths the overall percentage change to reveal underlying trends. Additionally, it calculates the slope of the moving average and converts it into an angle in degrees, which helps traders assess the strength and direction of market momentum.
Why it may be useful
This indicator offers traders a powerful, consolidated view of the most influential tech stocks' performance, enabling them to quickly gauge market sentiment and potential directional shifts. By aggregating data from seven major companies, it provides a more holistic perspective than analyzing individual stocks, helping traders make more informed decisions.
The moving average and angle calculations add depth to the analysis, allowing traders to understand not just the current market state, but also the momentum and potential future movement. Visual cues like color-coded percentage changes and angle measurements help traders quickly interpret complex market data.
When to explore it
The indicator is most effective during periods of high tech sector volatility or when traders want to understand the broader movement of major technology stocks. It can be particularly useful during earnings seasons, major market events, or when tracking overall market sentiment in the technology sector.
Traders can benefit from this indicator across various timeframes, from scalping to swing trading, by adjusting the moving average type and length. It's especially valuable when seeking to identify trend strength, potential momentum shifts, and comparative performance among the most significant tech companies.
Keep exploring
What we’ve verified
Access, alerts and repainting behaviour have not been independently verified for this indicator. Check the creator’s current publication and settings.
General descriptions and classifications are recovered research. Verified details above identify the specific checks we have completed. Check the creator’s current publication for later changes.