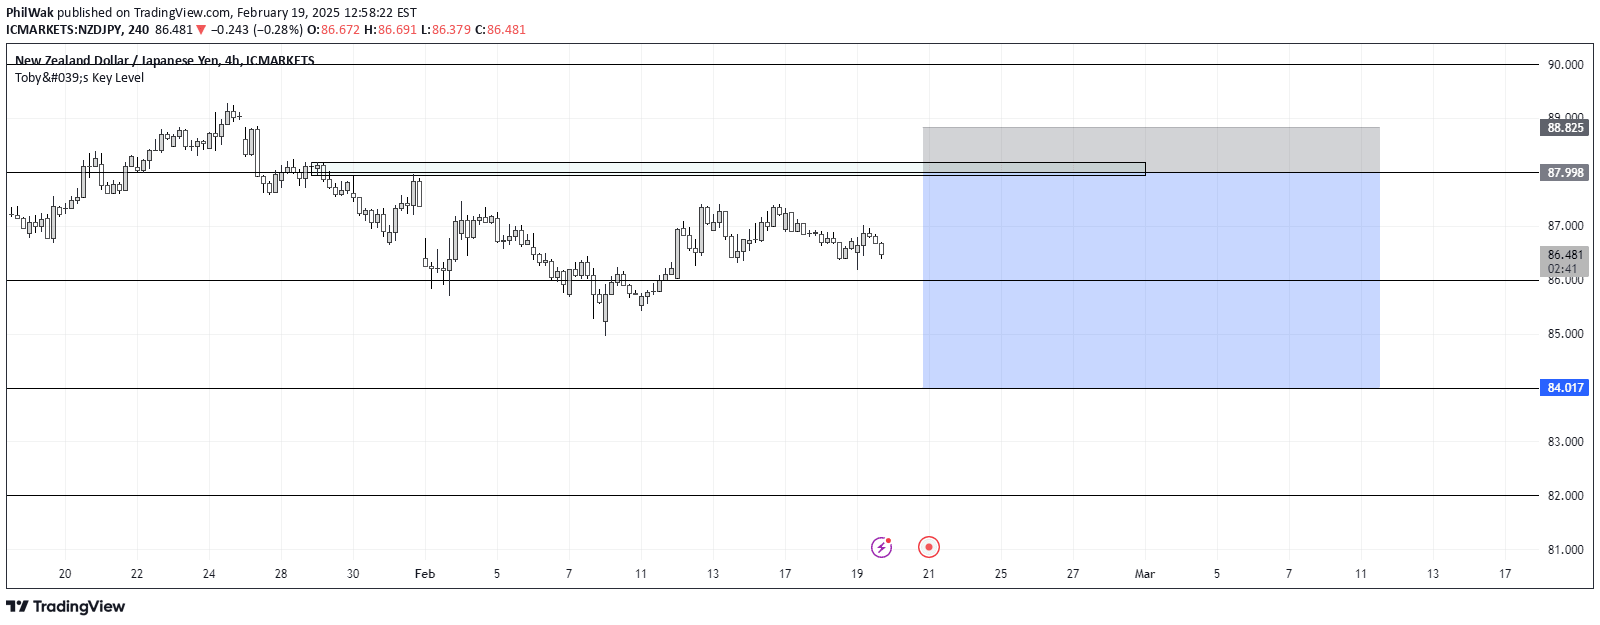
A customizable indicator that displays key market levels including daily, pre-market, and historical highs and lows to help traders identify potential support and resistance zones.
Explore complementary indicator rolesHow it works
The Key Levels indicator automatically plots critical price levels on a trading chart, including today's and yesterday's highs, lows, opens, and closes. It allows traders to select and customize up to 10 days of historical price levels, pre-market data, and pivot points, providing a comprehensive view of potential support and resistance zones.
The indicator dynamically combines similar key levels to prevent visual clutter and help traders identify stronger price zones. Users can individually enable or disable different levels, adjust colors, line styles, and text settings to suit their trading preferences and chart visibility.
Why it may be useful
Key levels are crucial for understanding market psychology and potential price reaction zones, where significant buying or selling pressure might emerge. By visualizing these important price points, traders can make more informed decisions about potential trend reversals, breakouts, and entry or exit points.
The indicator's flexibility in displaying multiple historical levels helps traders see beyond current price action and understand broader market context. By providing pre-market data and customizable settings, it empowers traders to develop a more comprehensive trading strategy based on multiple timeframe and historical price information.
When to explore it
The Key Levels indicator is most effective for day traders and scalpers who need quick insights into potential support and resistance zones. It works best in liquid markets with clear price action, such as major stock indices, forex pairs, and actively traded commodities where historical price levels have predictive value.
Traders should use this indicator alongside other technical analysis tools to confirm signals and make more robust trading decisions. It is particularly useful during periods of market consolidation, breakout attempts, and when analyzing intraday price movements that might be influenced by previous day's trading levels.
Keep exploring
What we’ve verified
Access, alerts and repainting behaviour have not been independently verified for this indicator. Check the creator’s current publication and settings.
General descriptions and classifications are recovered research. Verified details above identify the specific checks we have completed. Check the creator’s current publication for later changes.