Weekly Opening Gap (cryptonnnite)
A trading signal identifying significant price movement at market open caused by extraordinary news, using the opening gap as a potential trading target.
Explore 11,183 indicators. Filter beyond the obvious.
Discover the tools that fit the way you trade.
11,183 tools to explore
A trading signal identifying significant price movement at market open caused by extraordinary news, using the opening gap as a potential trading target.
A trading indicator that highlights previous market highs and lows, creating customizable support and resistance zones across multiple timeframes to help traders identify potential price reaction levels.
A psychological support/resistance indicator that identifies potential price reaction zones based on sequential candle movements and provides hypothetical support and resistance levels.
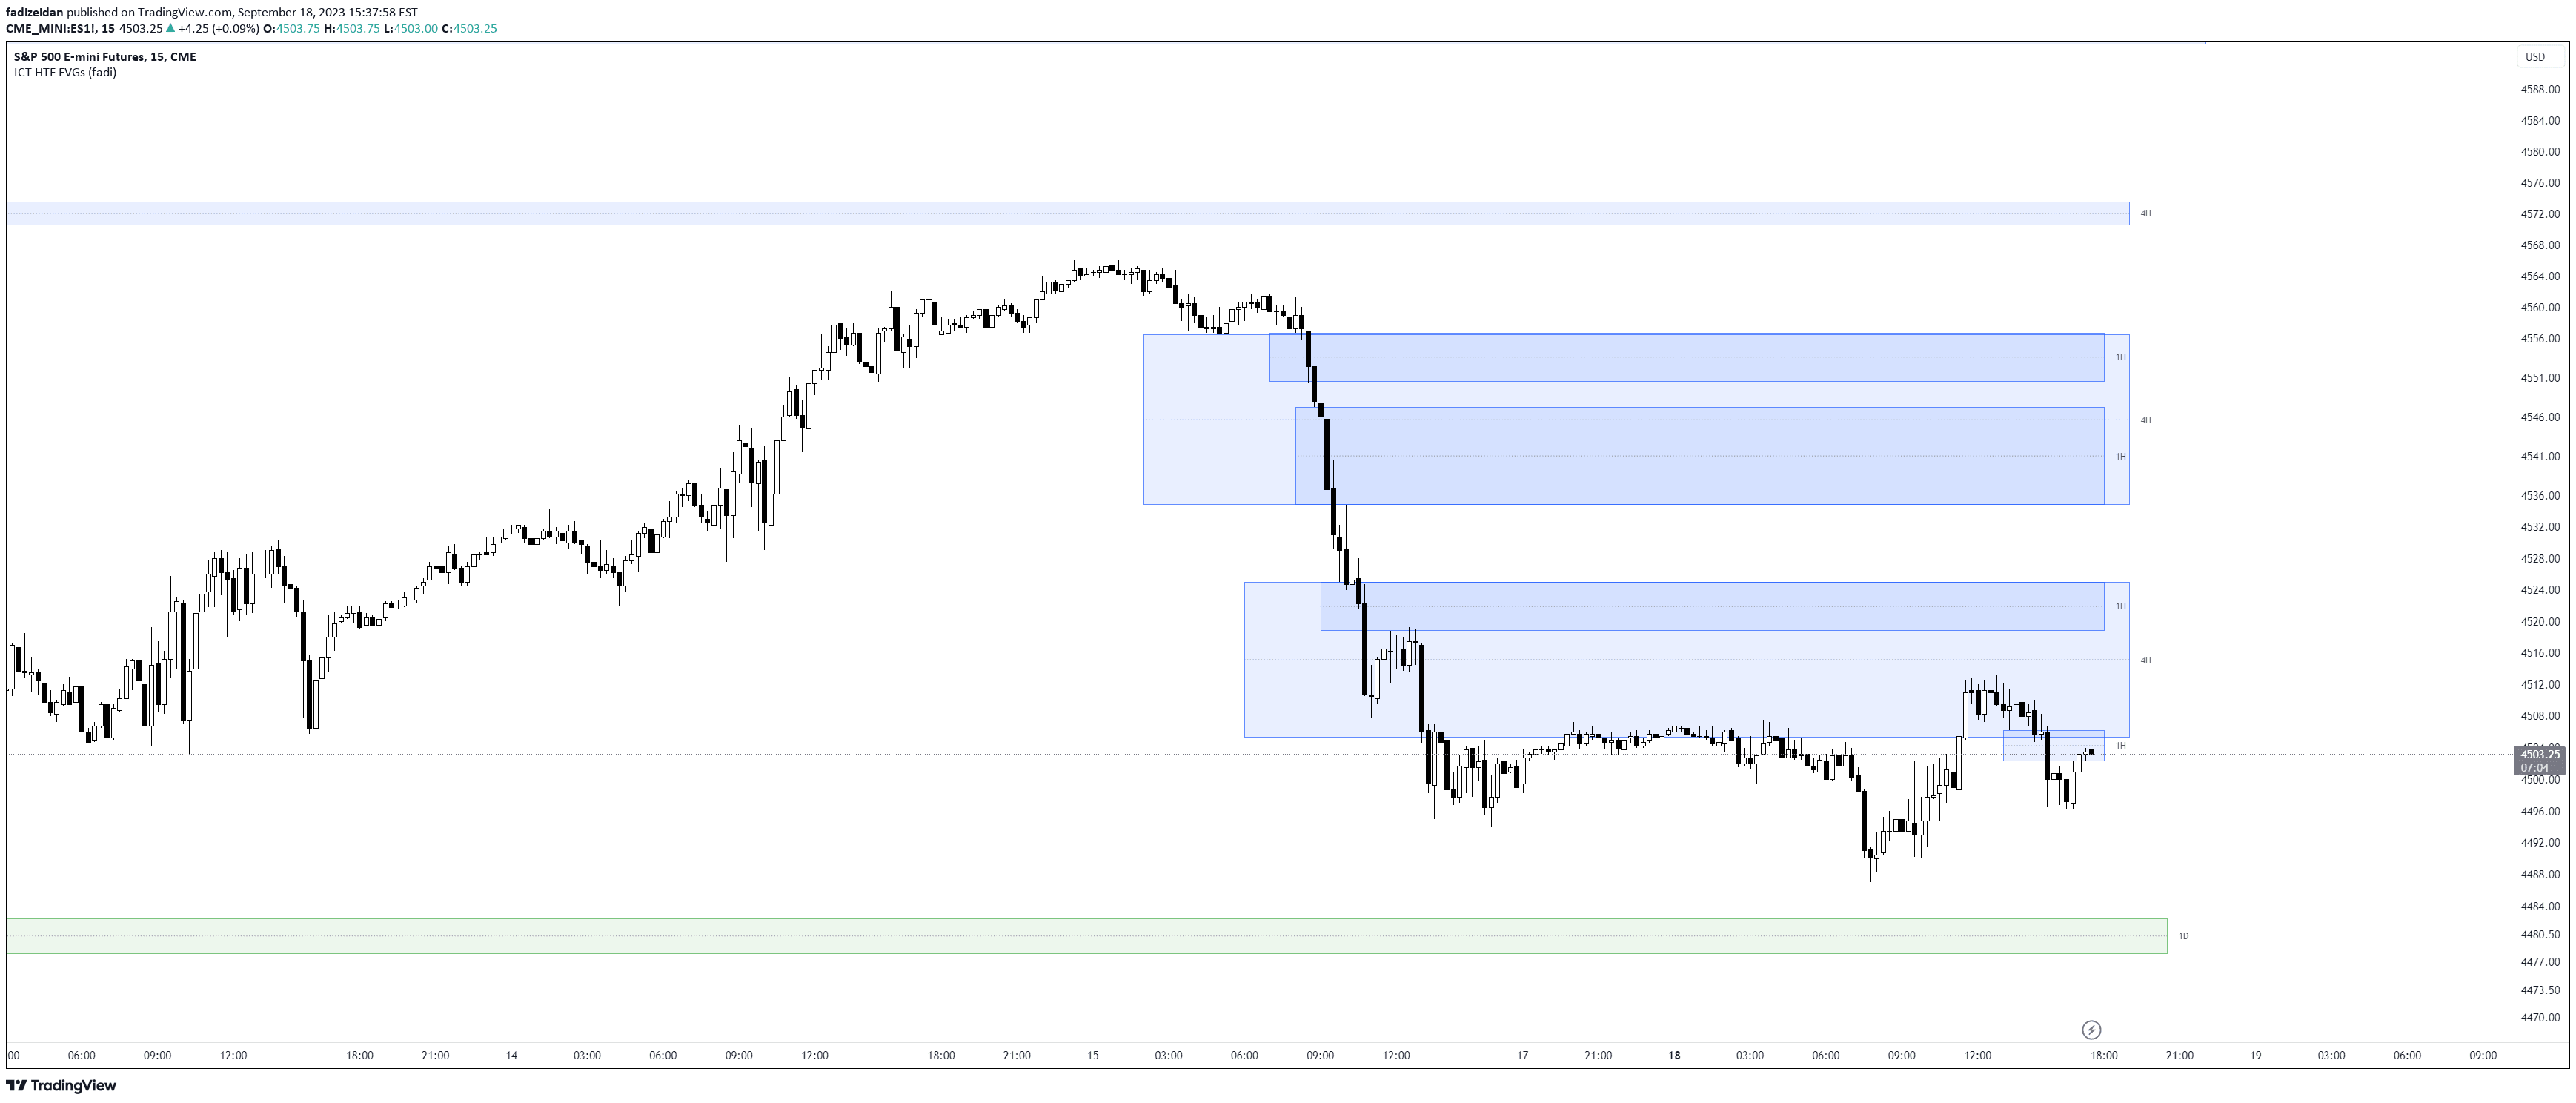
A multi-timeframe Fair Value Gap (FVG) indicator that identifies potential price reaction zones by analyzing overlapping price gaps across different chart periods.
A trading indicator that identifies potential liquidity zones by analyzing volume or open interest to reveal possible liquidation levels and market activity zones.
HTF Candle Volume Thermometer is an advanced volume heatmap tool that visualizes higher timeframe volume distribution, helping traders identify key liquidity zones and price levels.
An order block indicator that identifies key price accumulation zones, helping traders spot potential entry and exit points by highlighting supply and demand areas on the chart.
An advanced Smart Money Concept indicator that identifies swing high and low zones, helping traders determine premium and discount areas for optimal trade positioning and market structure analysis.
An indicator that displays higher timeframe Fair Value Gaps (FVGs) on the current chart, helping traders identify potential reversal or reaction zones across different timeframes.
A trading tool that identifies significant Order Blocks based on single candlestick patterns, highlighting potential institutional trading levels and price reaction zones.
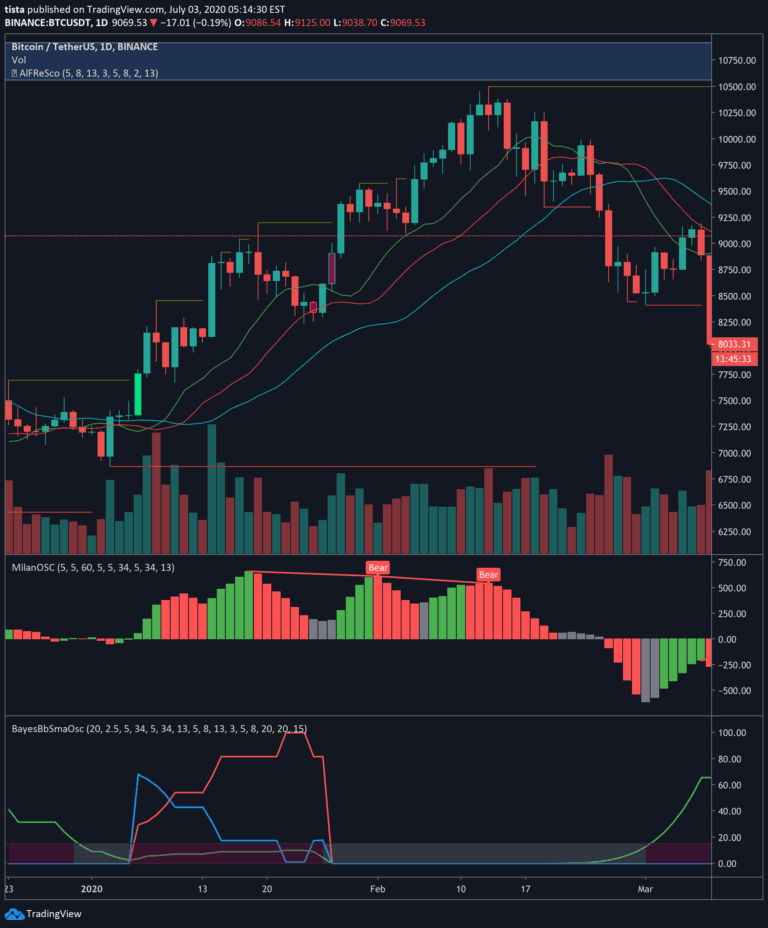
A Bayesian probability-based trading signal that predicts potential price breakouts using Bollinger Bands and Moving Average, focusing on classifying market movement probabilities.
A comprehensive trading indicator tracking price reactions across 16 timeframes, identifying fair value gaps, mitigation zones, session levels, and potential liquidity points of interest.
Likes, views, and comments are historical TradingView snapshots. They describe attention, not trading performance.