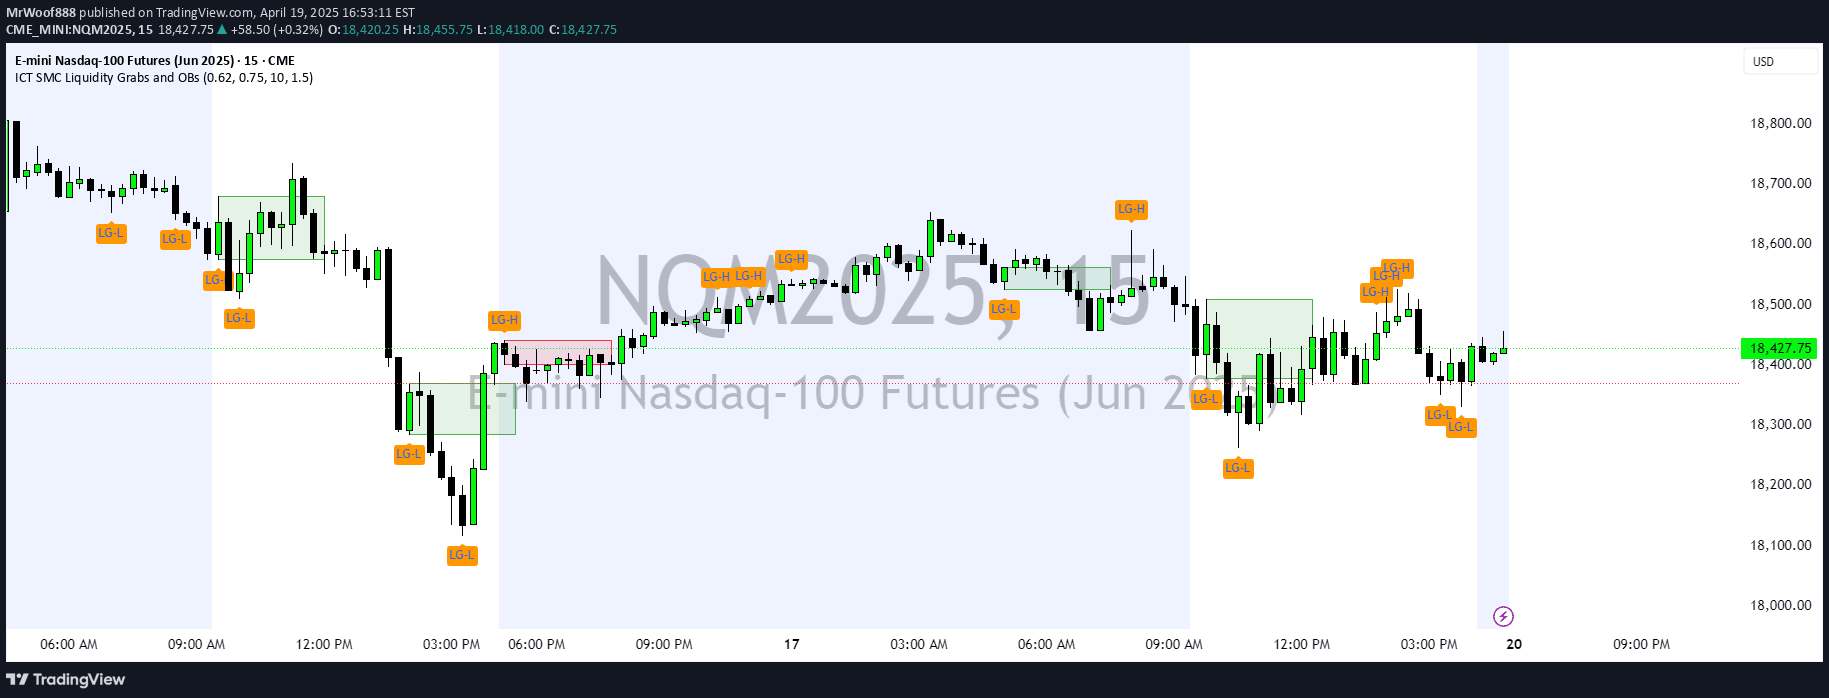
An order block indicator that identifies key price accumulation zones, helping traders spot potential entry and exit points by highlighting supply and demand areas on the chart.
Explore complementary indicator rolesHow it works
The order block indicator automatically plots key price accumulation zones on the trading chart, distinguishing between ascending (green) and descending (red) order blocks. It identifies these zones by recognizing specific market structure shifts like 'BOS' (Break of Structure) or 'CHOCH' (Change of Character) patterns, which signal potential trading opportunities.
Traders can refine these order blocks using two methods: defensive and aggressive. The defensive method minimizes the zone range for more precise entries, while the aggressive method expands the zone to capture more potential trade setups. The indicator continues plotting active order blocks until price reaches them, providing a clear visual representation of potential support and resistance levels.
Why it may be useful
Order block indicators are crucial for traders because they simplify complex market structures by highlighting key accumulation zones where significant price movements are likely to occur. By identifying these critical areas, traders can make more informed decisions about potential entry and exit points, reducing the visual clutter of multiple trend lines and market structure indicators.
The indicator's ability to distinguish between ascending and descending order blocks helps traders understand potential price direction and momentum. By providing a clear, simplified view of market structure, traders can more effectively analyze price action, manage risk, and identify high-probability trading opportunities across different market conditions and timeframes.
When to explore it
This order block indicator works best in range-bound or channeling markets where price tends to respect key support and resistance levels. It is particularly effective on timeframes like M1, M5, M15, H1, and H4, and during specific trading sessions such as Tokyo, Sydney, and London.
Traders should use this indicator when looking to confirm potential trade entries, especially when combined with additional confirmation signals like pin bars, divergence, or strong candlestick patterns. It is most valuable when traders wait for price reaction within the order block and look for at least a minimum candle movement to validate the trading signal.
Keep exploring
What we’ve verified
Access, alerts and repainting behaviour have not been independently verified for this indicator. Check the creator’s current publication and settings.
General descriptions and classifications are recovered research. Verified details above identify the specific checks we have completed. Check the creator’s current publication for later changes.