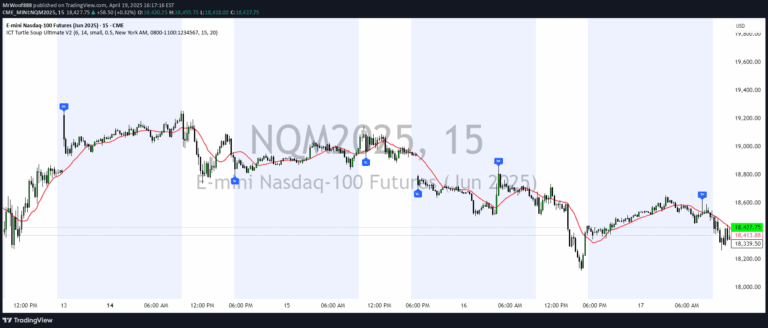
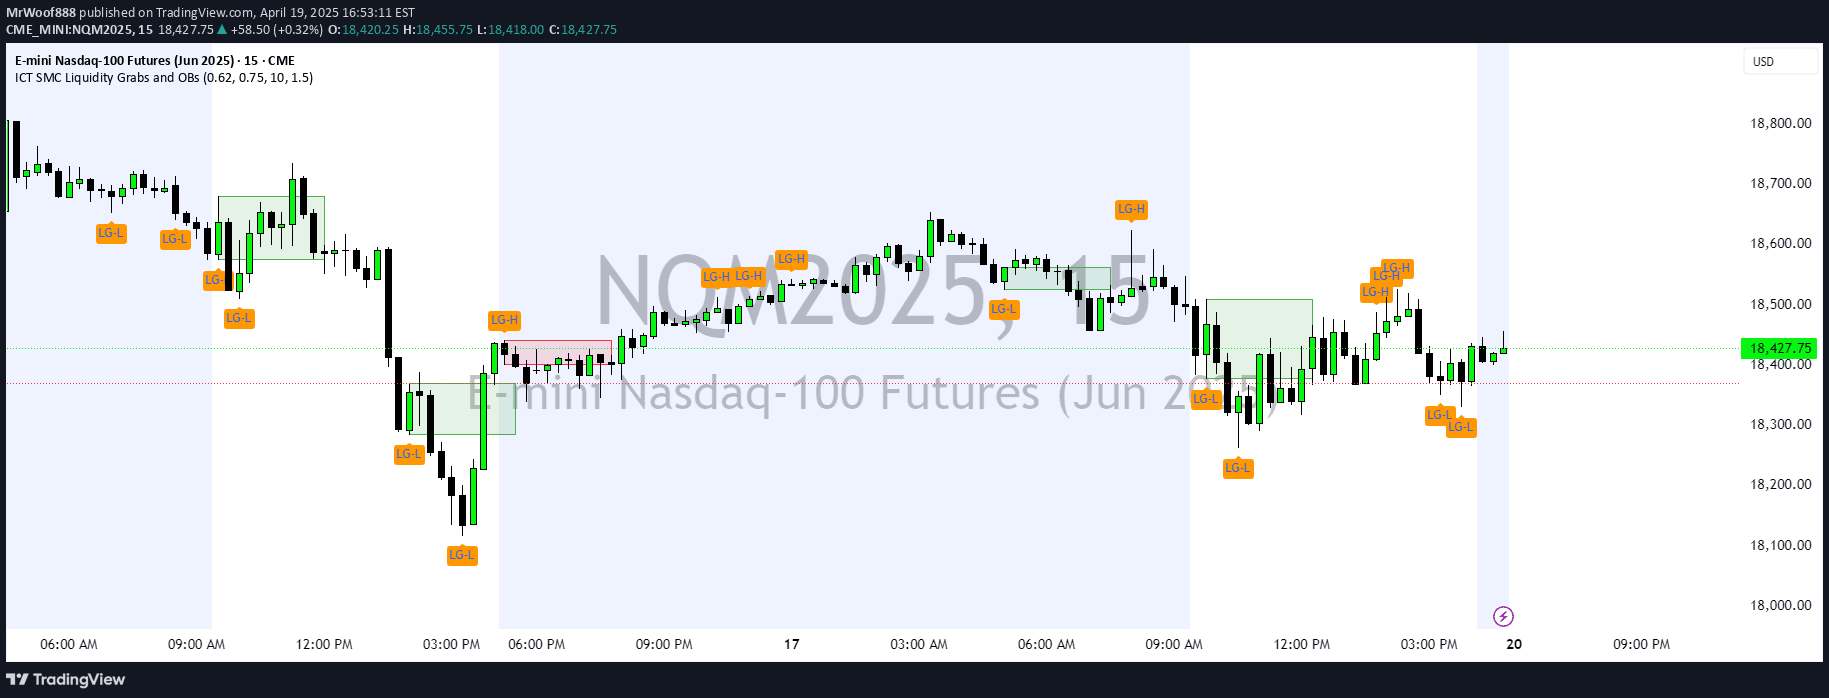
A Smart Money Concept liquidity detection tool that identifies and plots swing low levels, filters redundant zones, and provides daily high/low context for traders.
Explore complementary indicator rolesHow it works
The script uses a fixed pivot detection method with customizable parameters to identify structurally significant swing low levels in the market. It analyzes price action by comparing left and right pivot points, typically using a 3-bar lookback on intraday timeframes like 5m, 10m, and 15m charts.
Once detected, the swing low levels are filtered using a percentage-based spacing threshold to reduce noise and redundancy. The tool also implements a mitigation cleanup logic that tracks whether recent price action has breached past swing lows, automatically removing levels that are no longer relevant.
Why it may be useful
This liquidity detection tool provides traders with a clear, actionable map of potential liquidity zones that can be critical for making informed trading decisions. By identifying structurally significant swing lows and filtering out noise, traders can focus on the most meaningful liquidity levels that might indicate potential reversal points or liquidity grabs.
The built-in cleanup mechanism ensures that traders are always working with the most current and relevant liquidity information, removing mitigated levels automatically and keeping the chart clean and focused on active trading opportunities.
When to explore it
The tool is most effective on intraday charts between 5 and 15 minutes, making it ideal for traders focused on short-term price movements and liquidity-based strategies. It works best for traders employing Smart Money Concept (SMC) methodologies, particularly those interested in liquidity sweeps, mitigation blocks, and sweep-to-reverse trade models.
Traders should combine this tool with other complementary indicators like Fair Value Gap detectors or order block identifiers to create a comprehensive trading approach. It is particularly useful during periods of market volatility and when seeking to identify potential reversal zones or entry points following a liquidity sweep.
Keep exploring
What we’ve verified
Access, alerts and repainting behaviour have not been independently verified for this indicator. Check the creator’s current publication and settings.
General descriptions and classifications are recovered research. Verified details above identify the specific checks we have completed. Check the creator’s current publication for later changes.