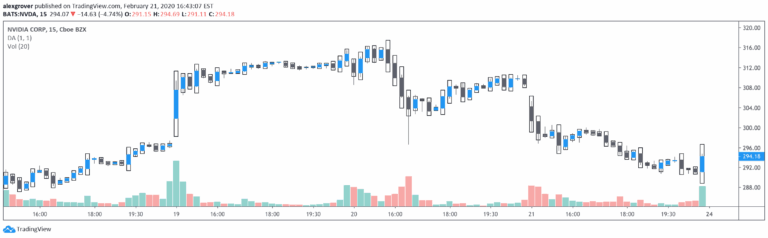
HTF Candle Volume Thermometer is an advanced volume heatmap tool that visualizes higher timeframe volume distribution, helping traders identify key liquidity zones and price levels.
Explore complementary indicator rolesHow it works
The HTF Candle Volume Thermometer operates by analyzing higher timeframe candles and creating a dynamic volume heatmap. It segments each candle into smaller levels, calculating volume distribution and intensity. The indicator colors candles green or red based on bullish or bearish sentiment, with gradient heat overlays showing volume concentration.
By marking the highest volume point within each candle, traders can quickly identify critical price levels. The tool uses color intensity and segmentation to provide a comprehensive view of volume dynamics across different timeframes
Why it may be useful
Understanding volume distribution is crucial for making informed trading decisions. This indicator helps traders identify where significant market activity occurs, revealing potential support and resistance levels. By visualizing volume concentration, traders can better assess market momentum and liquidity zones.
The heatmap provides insights into price behavior that might not be apparent from price action alone. Traders can use these volume insights to validate trend strength, confirm potential reversals, and optimize entry and exit points. This tool bridges the gap between price movement and underlying market activity
When to explore it
The HTF Candle Volume Thermometer is most effective when analyzing markets with substantial trading volume and clear price structures. It works best for traders seeking to understand volume dynamics across different timeframes. Ideal for swing and day traders who want to identify key liquidity zones and potential price reaction areas.
Most useful during trending markets where volume can confirm the strength of price movements. Particularly beneficial when trading major currency pairs, stock indices, and liquid commodities. Traders should combine this tool with other technical analysis methods for comprehensive market assessment
Keep exploring
What we’ve verified
Access, alerts and repainting behaviour have not been independently verified for this indicator. Check the creator’s current publication and settings.
General descriptions and classifications are recovered research. Verified details above identify the specific checks we have completed. Check the creator’s current publication for later changes.