
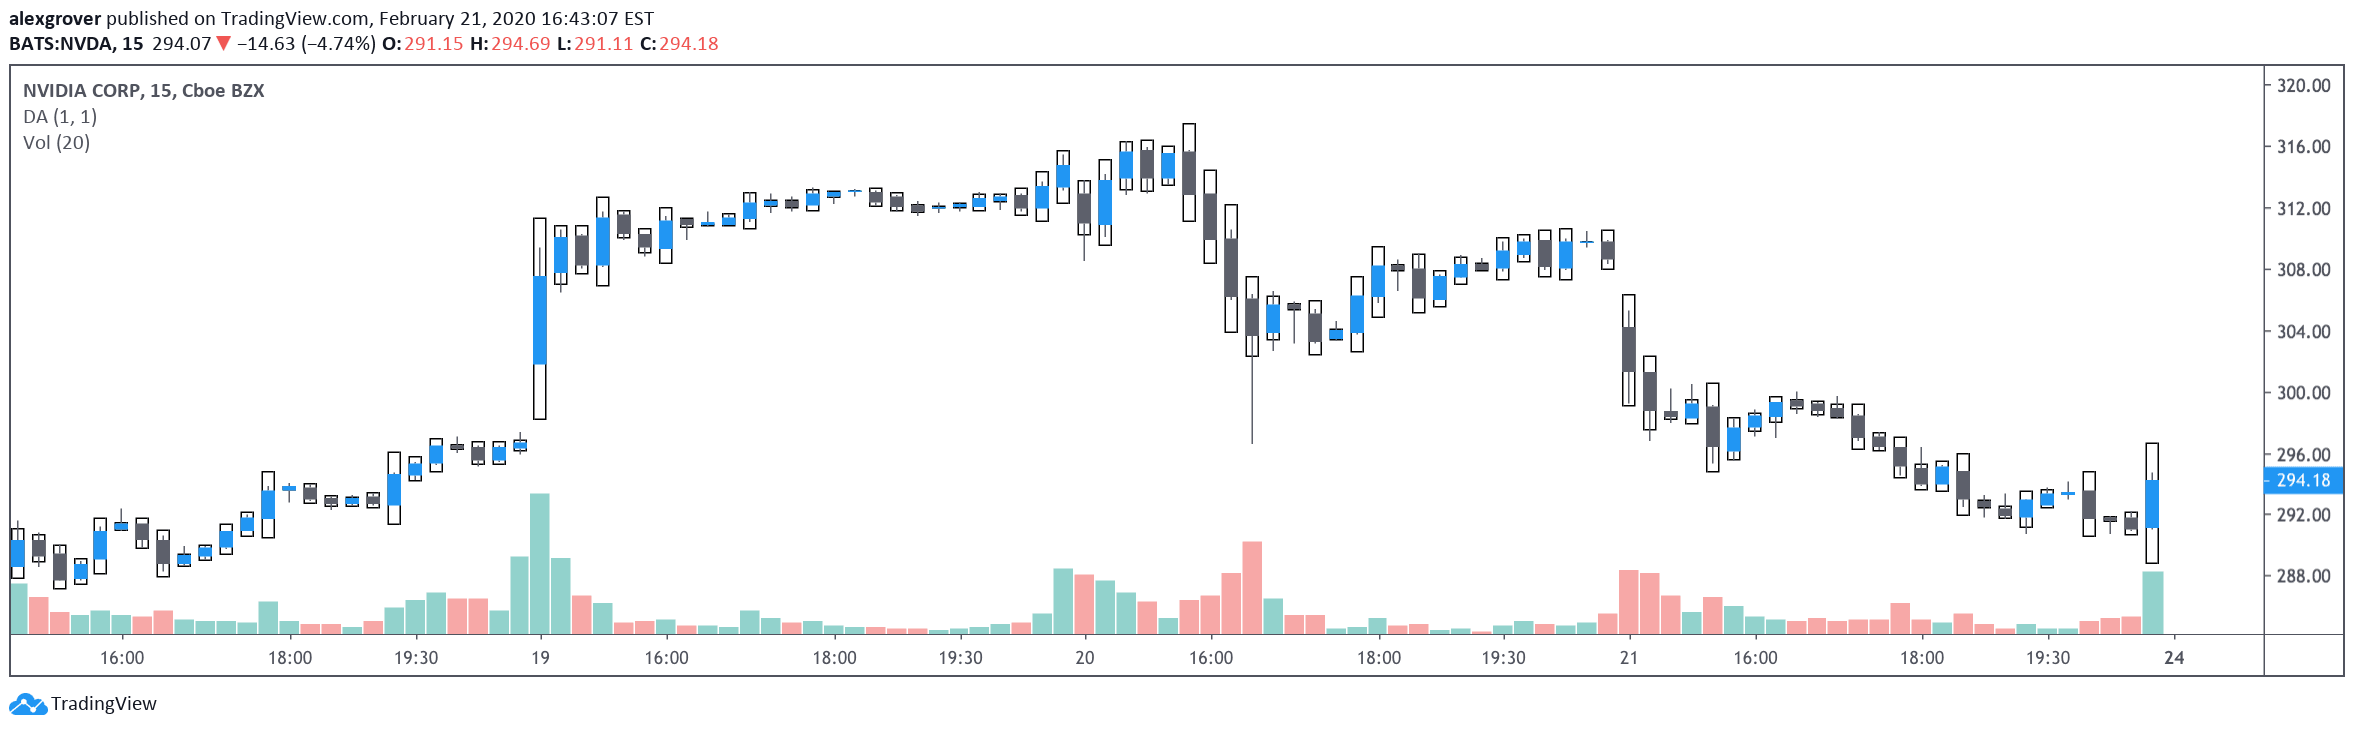
Dekidaka-Ashi is a unique candlestick visualization tool that integrates volume data with price action, creating enhanced candlesticks that reveal trading activity and potential market movements.
Explore complementary indicator rolesHow it works
Dekidaka-Ashi transforms traditional candlesticks by incorporating volume data into candle body visualization. The method rescales volume by dividing current volume by the sum of current and previous volume values. This normalized volume is then multiplied by the absolute price difference between open and close.
The resulting value modifies the candle's body size and position, providing visual insights into trading activity. By adjusting body size and smoothing volume data, traders can customize the indicator's sensitivity and clarity
Why it may be useful
This innovative approach solves a critical limitation in traditional candlestick charting by directly embedding volume information within price visualization. Traders gain immediate insights into market participation and potential trend strength without switching between different chart elements.
The method allows for quick identification of significant trading activity, potential support and resistance levels, and market sentiment. By presenting volume data seamlessly with price action, Dekidaka-Ashi enhances technical analysis decision-making
When to explore it
Dekidaka-Ashi works best during periods of moderate market volatility and consistent trading volume. It is particularly useful when analyzing stocks, forex, or cryptocurrency markets with stable trading patterns.
Traders should apply this tool when seeking to understand the relationship between price movements and trading volume. It is most effective on daily, 4-hour, and 1-hour timeframes. Optimal performance occurs in markets with clear trend tendencies and predictable volume characteristics
Keep exploring
What we’ve verified
Access, alerts and repainting behaviour have not been independently verified for this indicator. Check the creator’s current publication and settings.
General descriptions and classifications are recovered research. Verified details above identify the specific checks we have completed. Check the creator’s current publication for later changes.



