YOUR INDICATOR RESEARCH STARTS HERE

Find the right indicator.
Understand what it does.

Explore 11,183 indicators. Filter beyond the obvious.
Discover the tools that fit the way you trade.

THE INDICATOR LIBRARY

Explore the possibilities

11,183 tools to explore

20 indicators matching your filters
Save search
TrendEditor’s pick

TF Segmented Linear Regression

by alexgrover

A dynamic trend indicator that fits regression lines at different intervals, revealing market trends and potential price channels by calculating linear trends across specified timeframes.

Main price chart · unverifiedSwing Trading
Explore
3.1Klikes51.4Kviews27comments
Save
TrendMomentumEditor’s pick

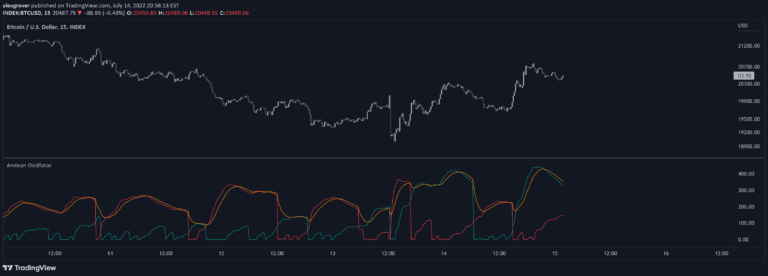
Andean Oscillator

by alexgrover

The Andean Oscillator is a trend analysis indicator that measures price variations by comparing bullish and bearish components to identify market direction and potential trend shifts.

Separate pane · unverifiedDay Trading · Swing Trading
Explore
2.6Klikes95Kviews86comments
Save
TrendMomentumEditor’s pick

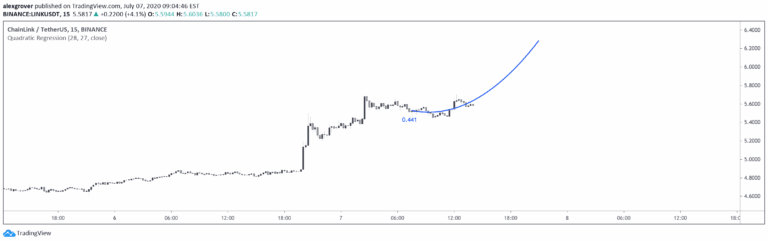
Quadratic Regression

by alexgrover

A quadratic regression indicator that fits a parabolic curve to price data, allowing traders to analyze non-linear trends and potentially forecast future price movements.

Main price chart · unverifiedDay Trading · Swing Trading
Explore
2.5Klikes45.8Kviews81comments
Save
TrendMomentumEditor’s pick

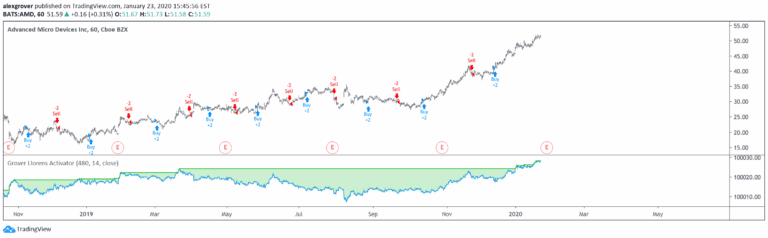
Grid Like Strategy

by alexgrover

A grid trading strategy using martingale position sizing that doubles position size after losses, aiming to recover from previous trades by increasing exposure with each unsuccessful trade.

Main price chart · unverifiedDay Trading · Swing Trading
Explore
2.4Klikes52.7Kviews14comments
Save
TrendMomentumEditor’s pick

Swing High/Low Anchored Spiral

by alexgrover

An innovative trading signal that fits an Archimedean spiral to price action, allowing traders to visualize price movement through a unique geometric representation with customizable parameters.

Main price chart · unverifiedSwing Trading
Explore
2.2Klikes97.8Kviews32comments
Save
TrendMomentumEditor’s pick

Uhl MA Crossover System

by alexgrover

The Corrected Moving Average (CMA) is an adaptive moving average system designed to minimize false signals in sideways markets and provide more accurate trend identification across different market conditions.

Main price chart · unverifiedDay Trading · Swing Trading
Explore
2Klikes38.4Kviews50comments
Save
TrendMomentumEditor’s pick

Intersection Value Functions

by alexgrover

Advanced trading signal that calculates precise intersection points between two data series, offering detailed insights into potential trend changes and crossover events.

Main price chart · unverifiedDay Trading · Swing Trading
Explore
1.3Klikes61.5Kviews22comments
Save
VolumeTrendEditor’s pick

Gap Filling Strategy

by alexgrover

A trading strategy focused on identifying and trading significant price gaps in stock markets, exploiting the difference between opening and previous closing prices to generate trading signals.

Main price chart · unverifiedDay Trading · Swing Trading
Explore
1.2Klikes37.7Kviews11comments
Save
TrendVolatilityEditor’s pick

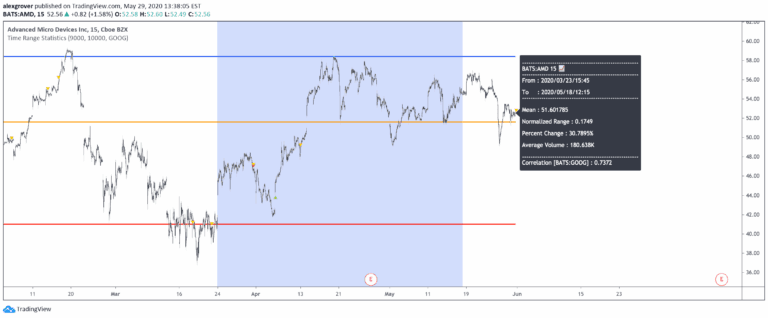
Time Range Statistics

by alexgrover

A comprehensive trading script that calculates various price statistics within a user-selected range, offering insights into price movement, volatility, and market trends through statistical analysis.

Main price chart · unverifiedDay Trading · Swing Trading
Explore
1.1Klikes36.4Kviews16comments
Save

Likes, views, and comments are historical TradingView snapshots. They describe attention, not trading performance.

START WITH A QUESTION

A little less searching.
A lot more understanding.

Tell DeepAlpha what you need. Get an explanation, a shortlist,
and a direct path to the indicators behind it.

Ask DeepAlpha