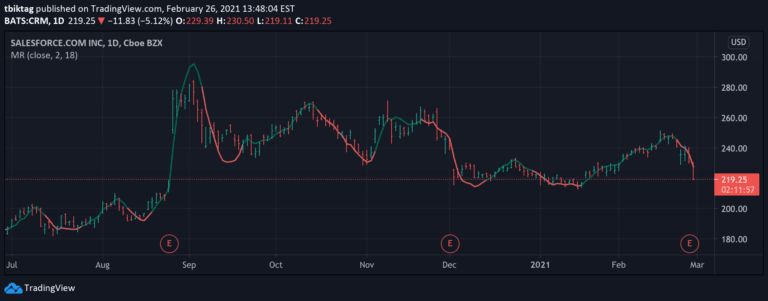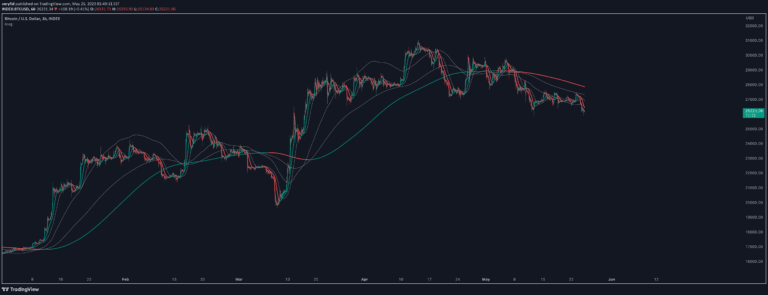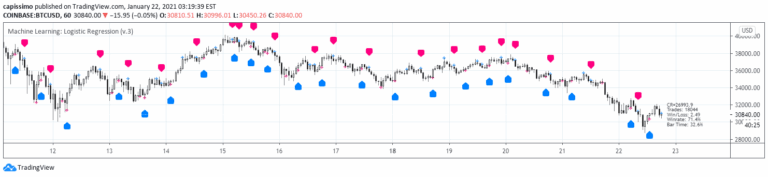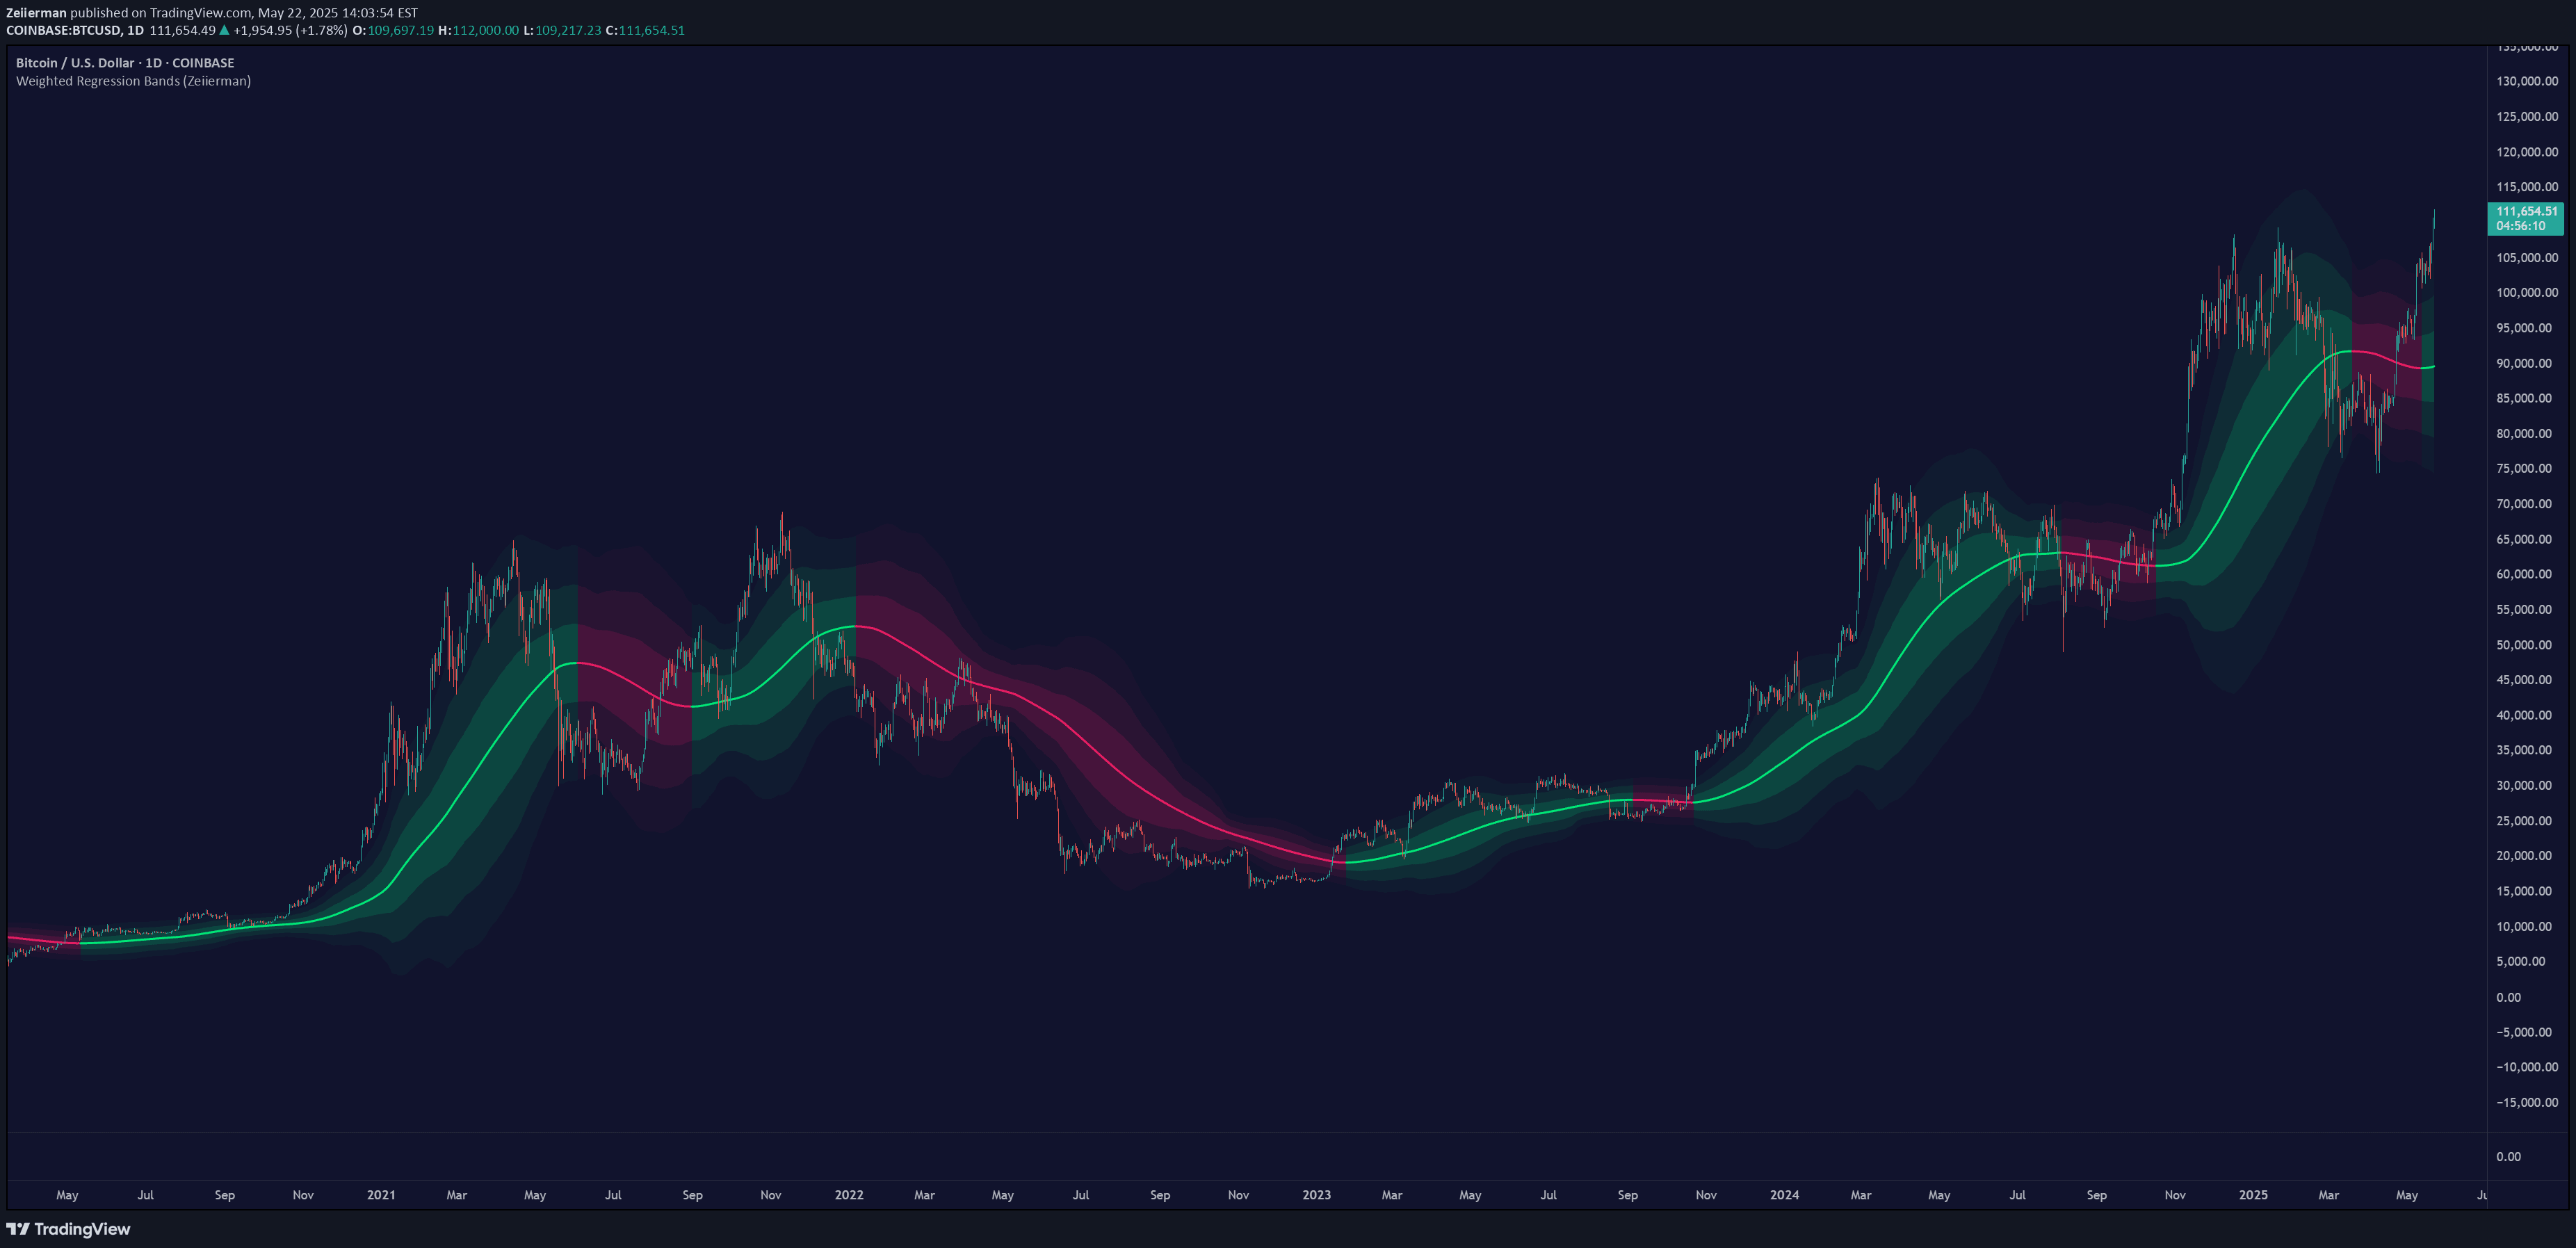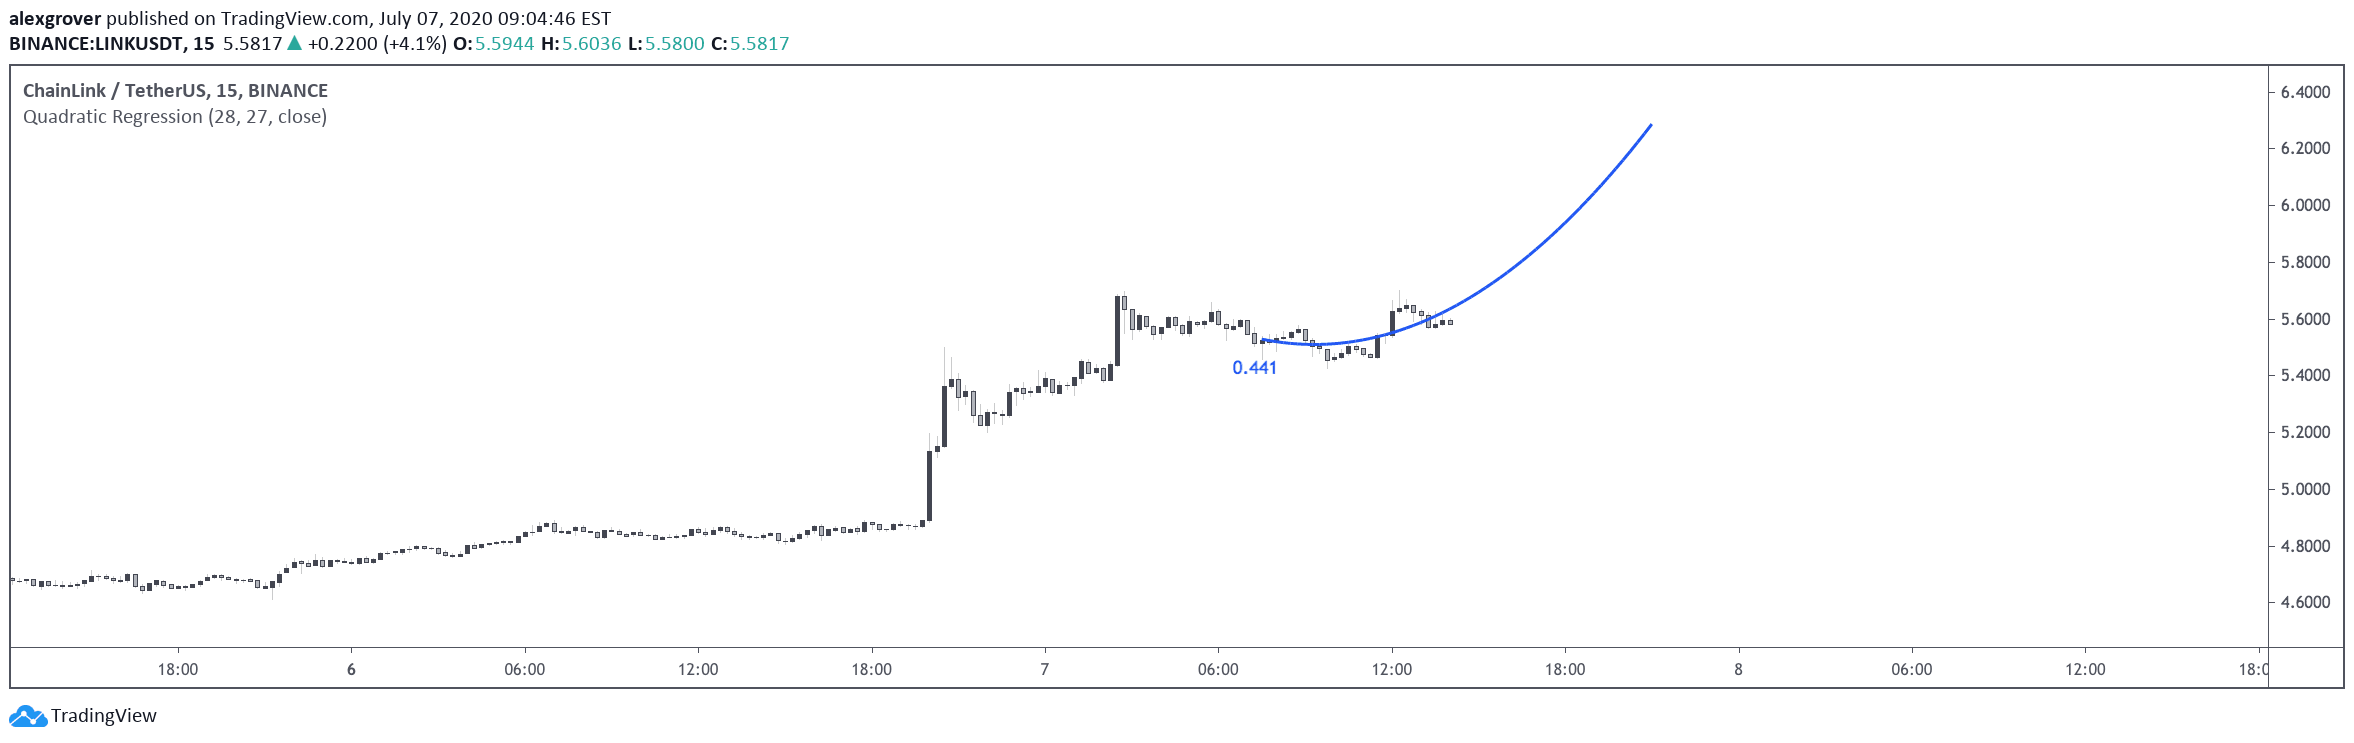
A quadratic regression indicator that fits a parabolic curve to price data, allowing traders to analyze non-linear trends and potentially forecast future price movements.
Explore complementary indicator rolesHow it works
The quadratic regression indicator uses a second-degree polynomial to fit the last specified number of data points, creating a curved line that represents the underlying price trend.
By minimizing the sum of squared differences between actual and fitted data, the algorithm generates a model that can capture non-linear price movements. The indicator calculates coefficients for a parabolic curve that best represents the data, allowing for potential future extrapolation and trend prediction beyond linear models
Why it may be useful
This indicator provides traders with a more nuanced view of price trends compared to traditional linear regression models. By capturing parabolic movements, it can reveal complex market dynamics and potential trend reversals that linear models might miss.
The R-squared value helps traders assess the model's accuracy and the strength of the underlying trend. It offers insights into market behavior when price movements are not strictly linear, enabling more sophisticated trend analysis and potential predictive strategies
When to explore it
The quadratic regression is most effective when price trends demonstrate non-linear characteristics, such as gradually changing momentum or curved price patterns. It works best in markets with clear, evolving trends rather than choppy or highly volatile environments.
Traders should use this indicator when seeking to understand underlying trend dynamics beyond simple linear progression. It is particularly useful for swing traders and longer-term investors analyzing medium-term price movements across various financial instruments
Keep exploring
What we’ve verified
Access, alerts and repainting behaviour have not been independently verified for this indicator. Check the creator’s current publication and settings.
General descriptions and classifications are recovered research. Verified details above identify the specific checks we have completed. Check the creator’s current publication for later changes.