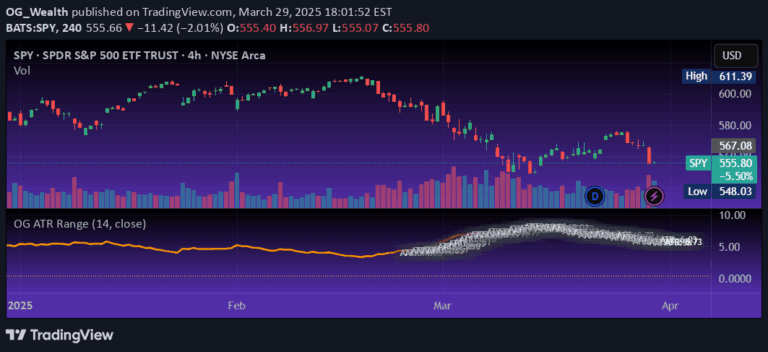
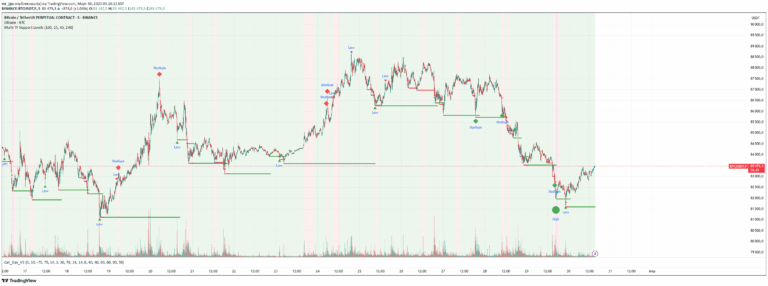
A trend and volatility indicator that uses weighted high/low analysis to generate a fair value line with dynamic standard deviation bands, adapting to market structure and volatility.
Explore complementary indicator rolesHow it works
The Weighted Regression Bands indicator starts by analyzing market structure through a custom high/low weighting system that calculates a median price. It offers three weighting methods: Simple, Advanced, and Smooth, each providing different levels of sensitivity and structural analysis. The indicator then applies smoothing techniques like ALMA or Linear Regression to project a fair value line, which represents the underlying market trend.
Before generating the trend calculation, an optional Kalman-style smoothing filter can be applied to reduce false trend shifts and enhance signal clarity. Around the fair value line, the indicator constructs dynamic standard deviation bands at ±1, ±2, and ±3 standard deviations, which expand and contract based on recent price volatility.
Why it may be useful
The Weighted Regression Bands indicator provides traders with a sophisticated tool for understanding market dynamics beyond simple price movement. By incorporating advanced weighting and smoothing techniques, it offers a more nuanced view of market structure, helping traders identify true trend directions and potential trend shifts more accurately than traditional indicators.
The dynamic volatility bands offer additional insights by visualizing potential overbought or oversold conditions. This allows traders to not only understand the trend but also gauge market momentum and potential reversal points, making it a comprehensive analysis tool that bridges trend identification and volatility assessment.
When to explore it
This indicator is most effective in markets with clear directional movements and moderate to high volatility. Traders can use the fair value line to identify the dominant market trend and make trades aligned with that direction, increasing the probability of successful entries. The outer deviation bands are particularly useful for identifying potential trend exhaustion points and mean reversion opportunities.
The flexible settings, including adjustable lookback length, smoothing methods, and deviation multipliers, make this indicator adaptable to different trading styles and market conditions. It is particularly valuable for traders seeking a more intelligent and responsive trend analysis tool that can adapt to changing market structures.
Keep exploring
What we’ve verified
Access, alerts and repainting behaviour have not been independently verified for this indicator. Check the creator’s current publication and settings.
General descriptions and classifications are recovered research. Verified details above identify the specific checks we have completed. Check the creator’s current publication for later changes.