
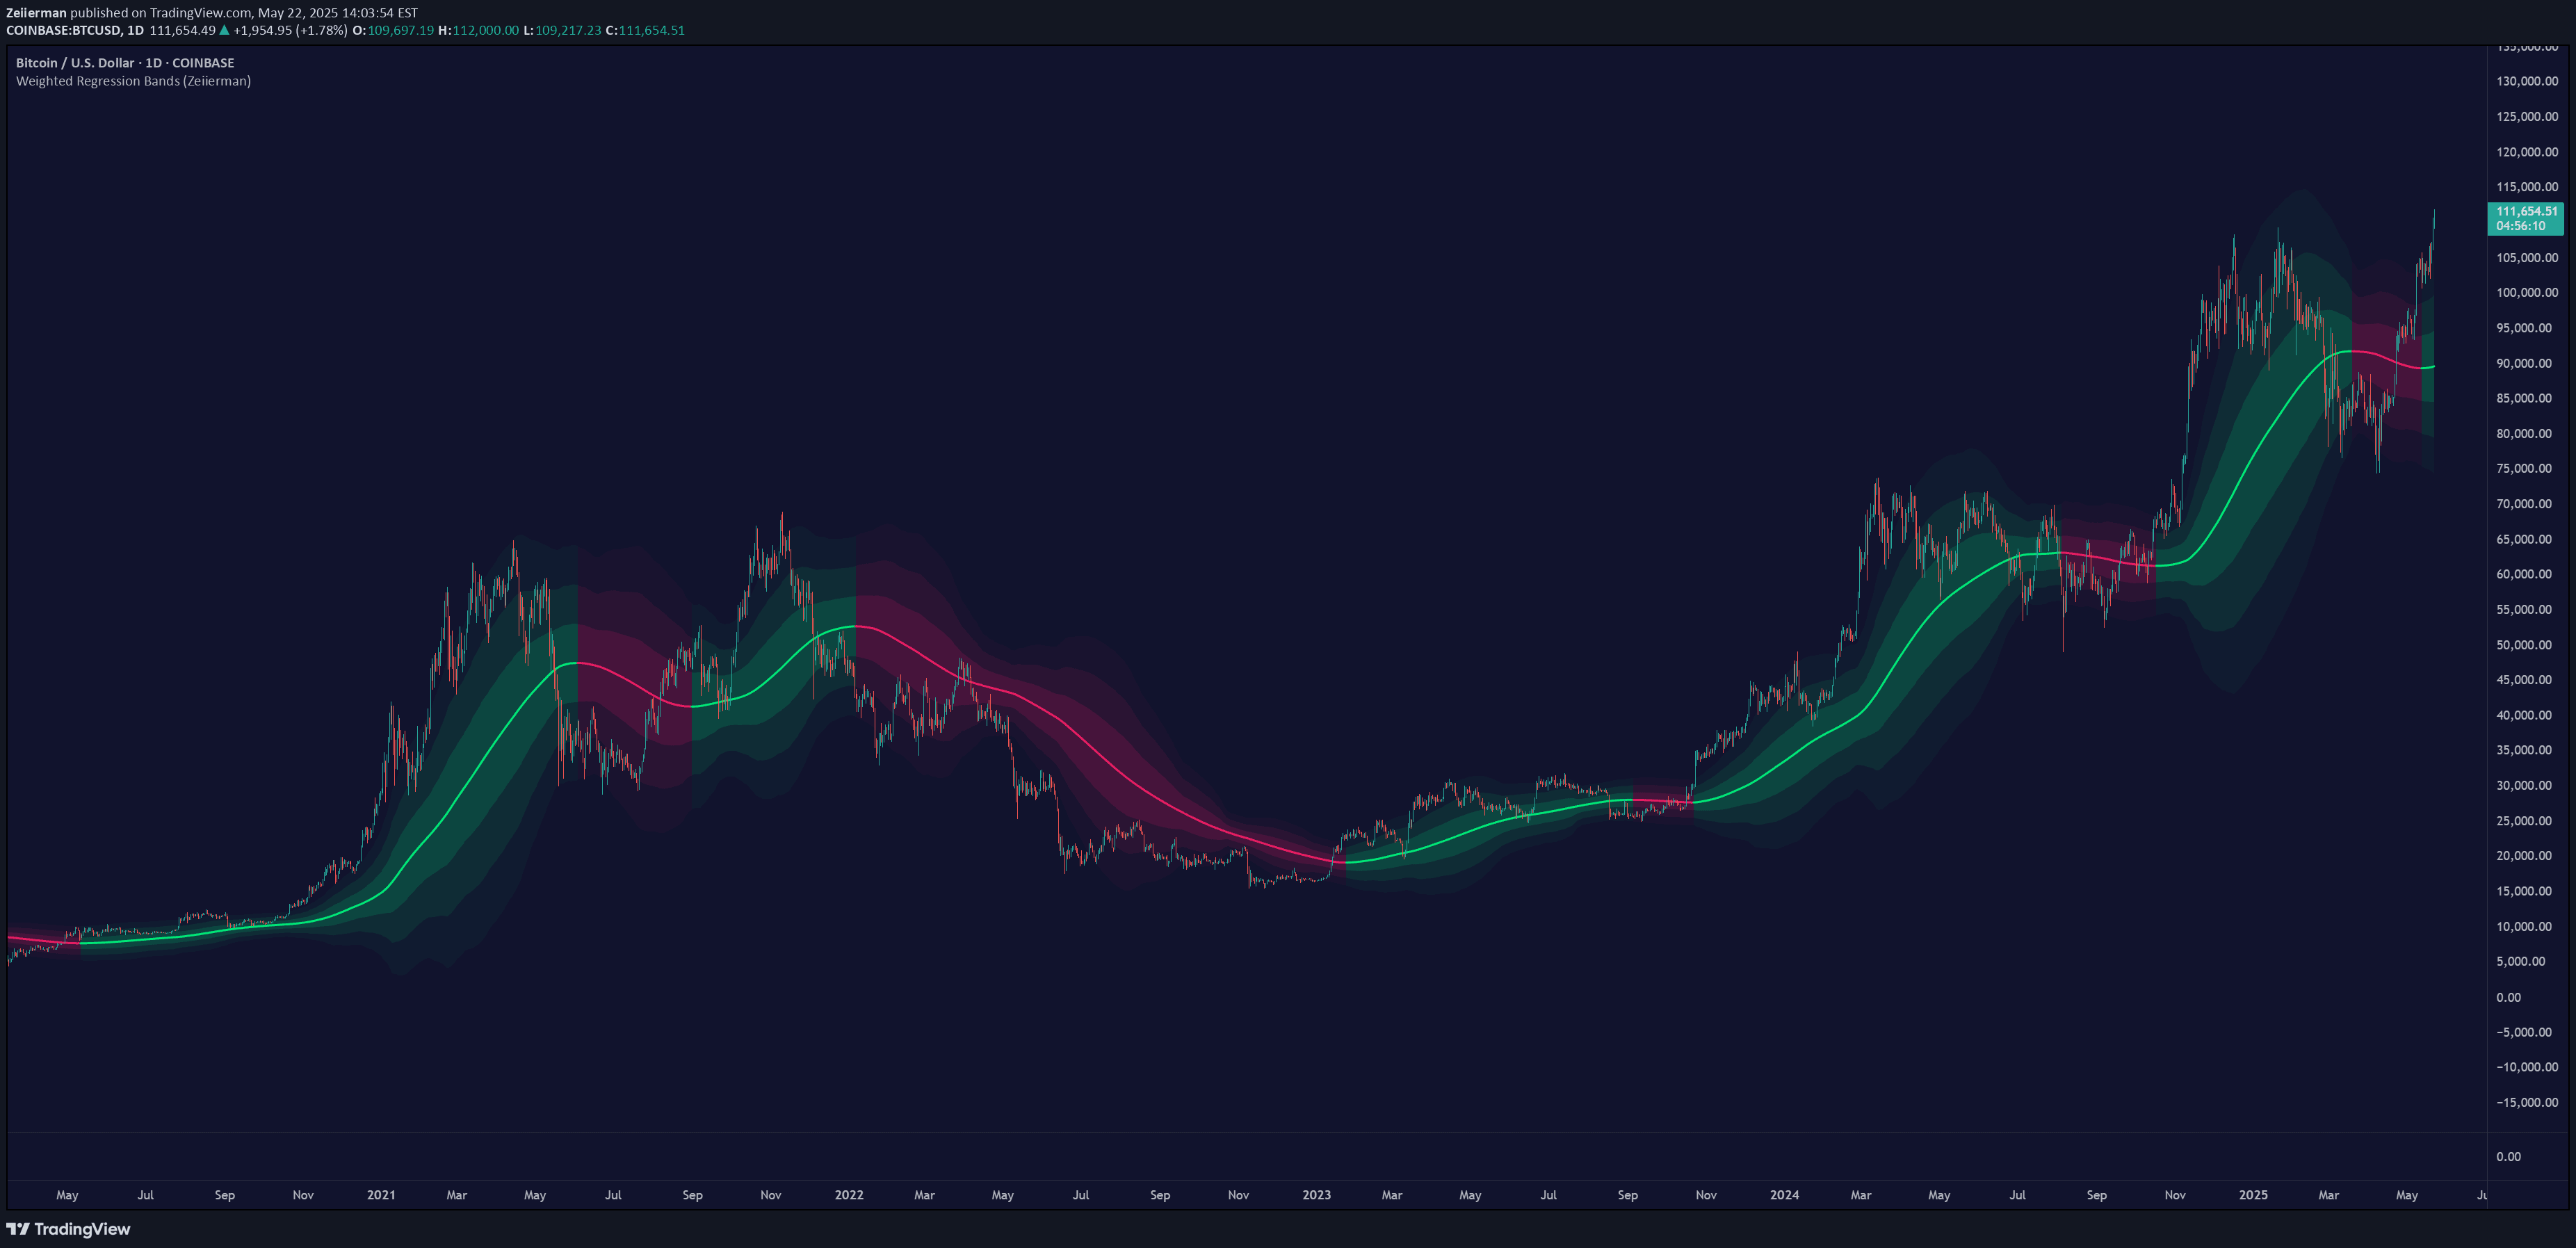
Weighted Regression Bands (Zeiierman)
A trend and volatility indicator that uses weighted high/low analysis to generate a fair value line with dynamic standard deviation bands, adapting to market structure and volatility.
Explore 11,183 indicators. Filter beyond the obvious.
Discover the tools that fit the way you trade.
11,183 tools to explore
A trend and volatility indicator that uses weighted high/low analysis to generate a fair value line with dynamic standard deviation bands, adapting to market structure and volatility.
Multi-timeframe linear regression indicator that displays price trends and potential overbought/oversold conditions across different time frames using adaptive bands.
A logarithmic regression channel that analyzes price trends by transforming data and plotting a central regression line with deviation bands to identify potential support and resistance levels.
A dynamic linear regression channel indicator allowing precise channel selection and customization, helping traders identify potential price bounces, breakouts, and wave patterns across different timeframes.
Likes, views, and comments are historical TradingView snapshots. They describe attention, not trading performance.