
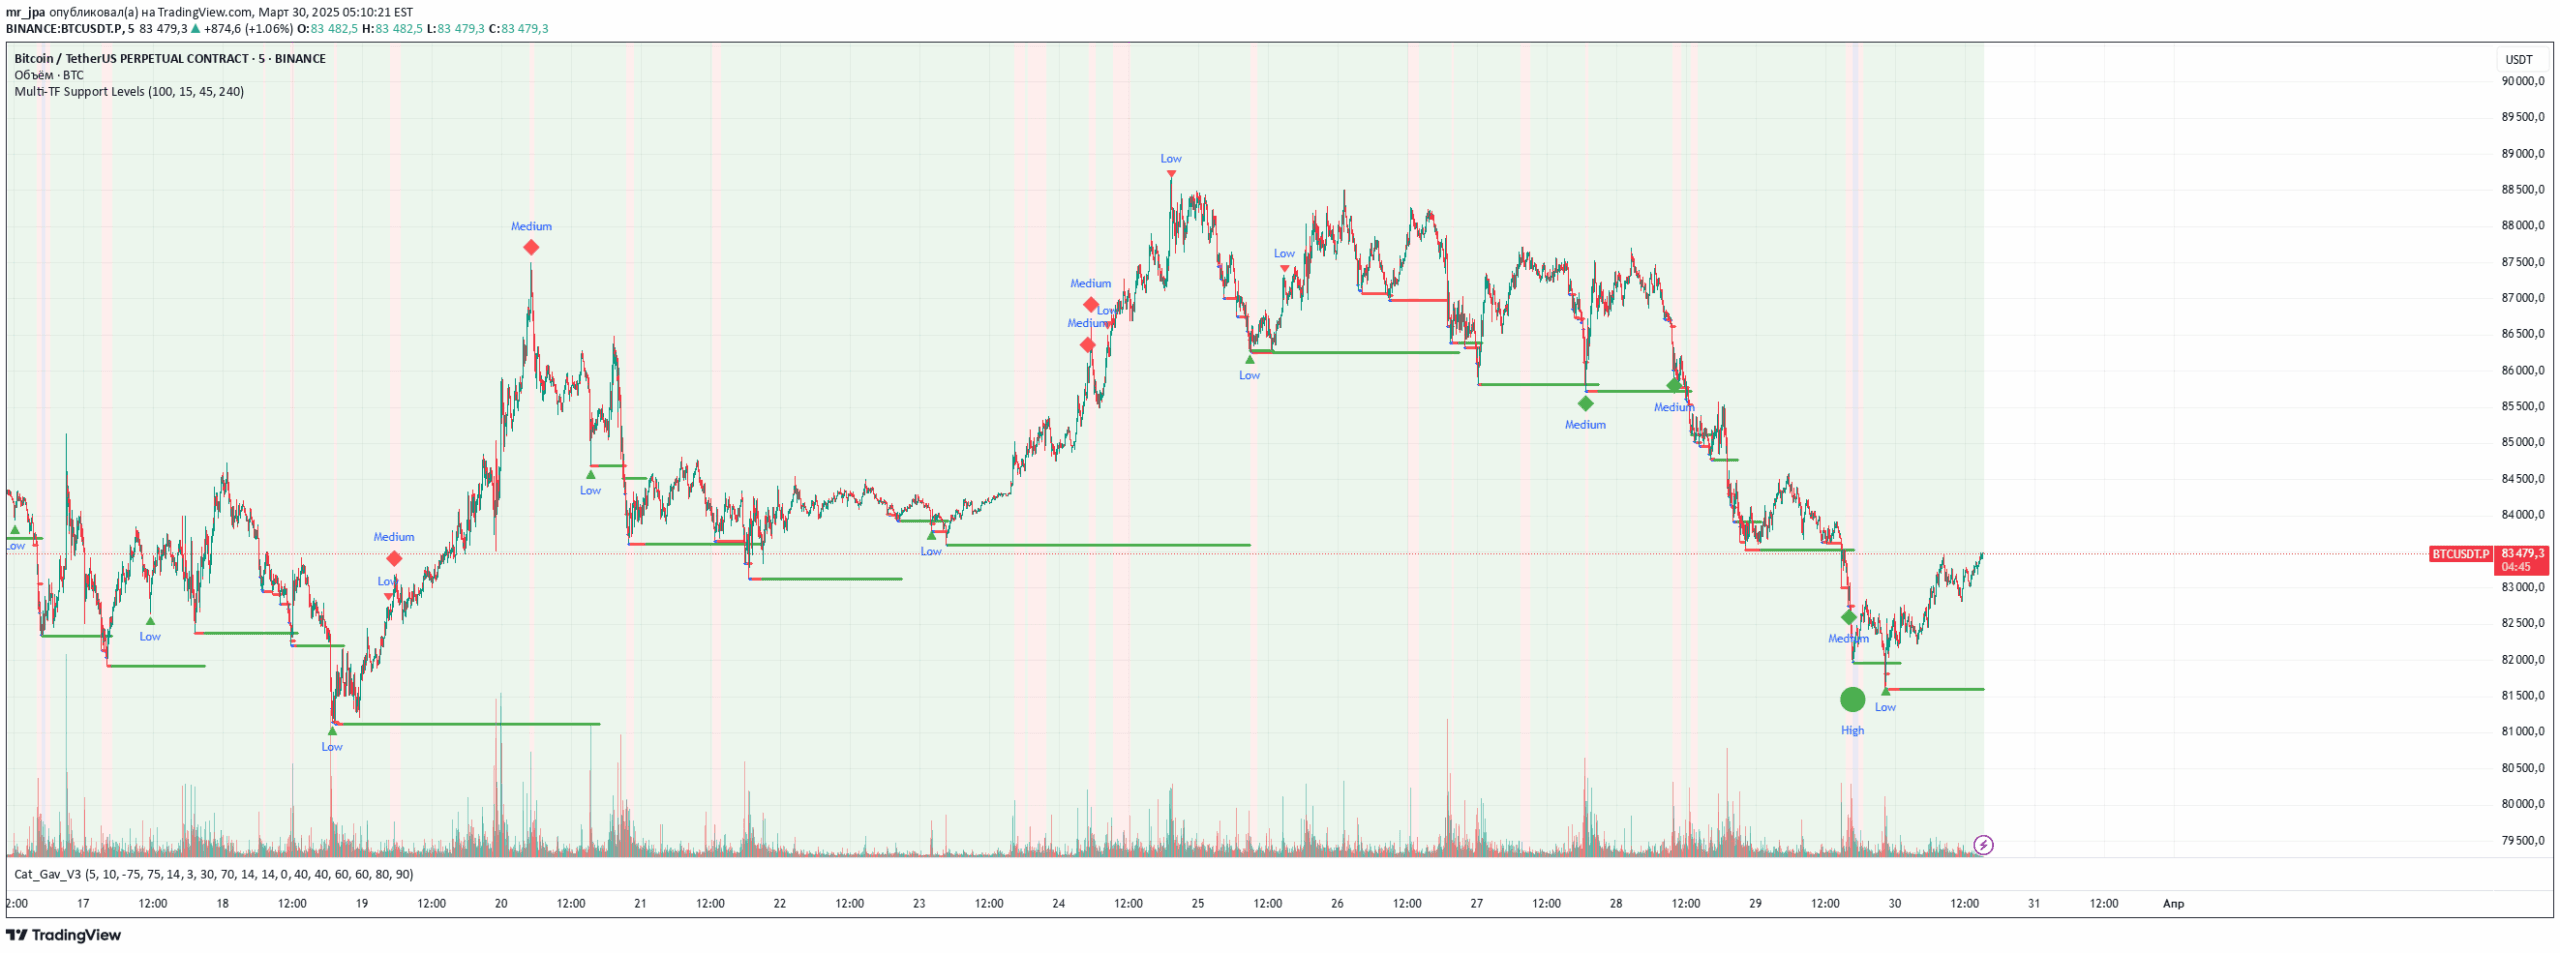
A multi-timeframe support level indicator that identifies key swing low points across three different timeframes to help traders visualize potential support zones and trading opportunities.
Explore complementary indicator rolesHow it works
The Multi-TF Support Levels indicator scans historical price data across three selected timeframes using a 100-period lookback. For each timeframe, it identifies swing lows by finding the lowest price point that is lower than the two preceding candles.
These swing lows are used to plot dynamic support levels. The indicator automatically updates these levels as new swing lows form. The most recent support levels are displayed as horizontal cross marks in different colors representing each timeframe
Why it may be useful
This indicator provides traders with a comprehensive view of potential support zones across multiple timeframes. By identifying confluent support levels, traders can make more informed trading decisions. The multi-timeframe approach helps reduce false signals and increases the reliability of support level identification.
Traders can use these levels to plan entry points, set stop-loss levels, and understand potential price reversal zones. The visual representation makes it easier to quickly assess market structure and potential trading opportunities
When to explore it
The Multi-TF Support Levels indicator works best in trending and range-bound markets. It is particularly useful for swing traders and day traders looking to identify strong support zones. Traders should use this indicator when seeking to confirm potential entry or exit points across different timeframes.
It is most effective in markets with clear price structures and during periods of moderate volatility. The indicator can be especially valuable when combined with other technical analysis tools to validate trading signals
Keep exploring
What we’ve verified
Access, alerts and repainting behaviour have not been independently verified for this indicator. Check the creator’s current publication and settings.
General descriptions and classifications are recovered research. Verified details above identify the specific checks we have completed. Check the creator’s current publication for later changes.


