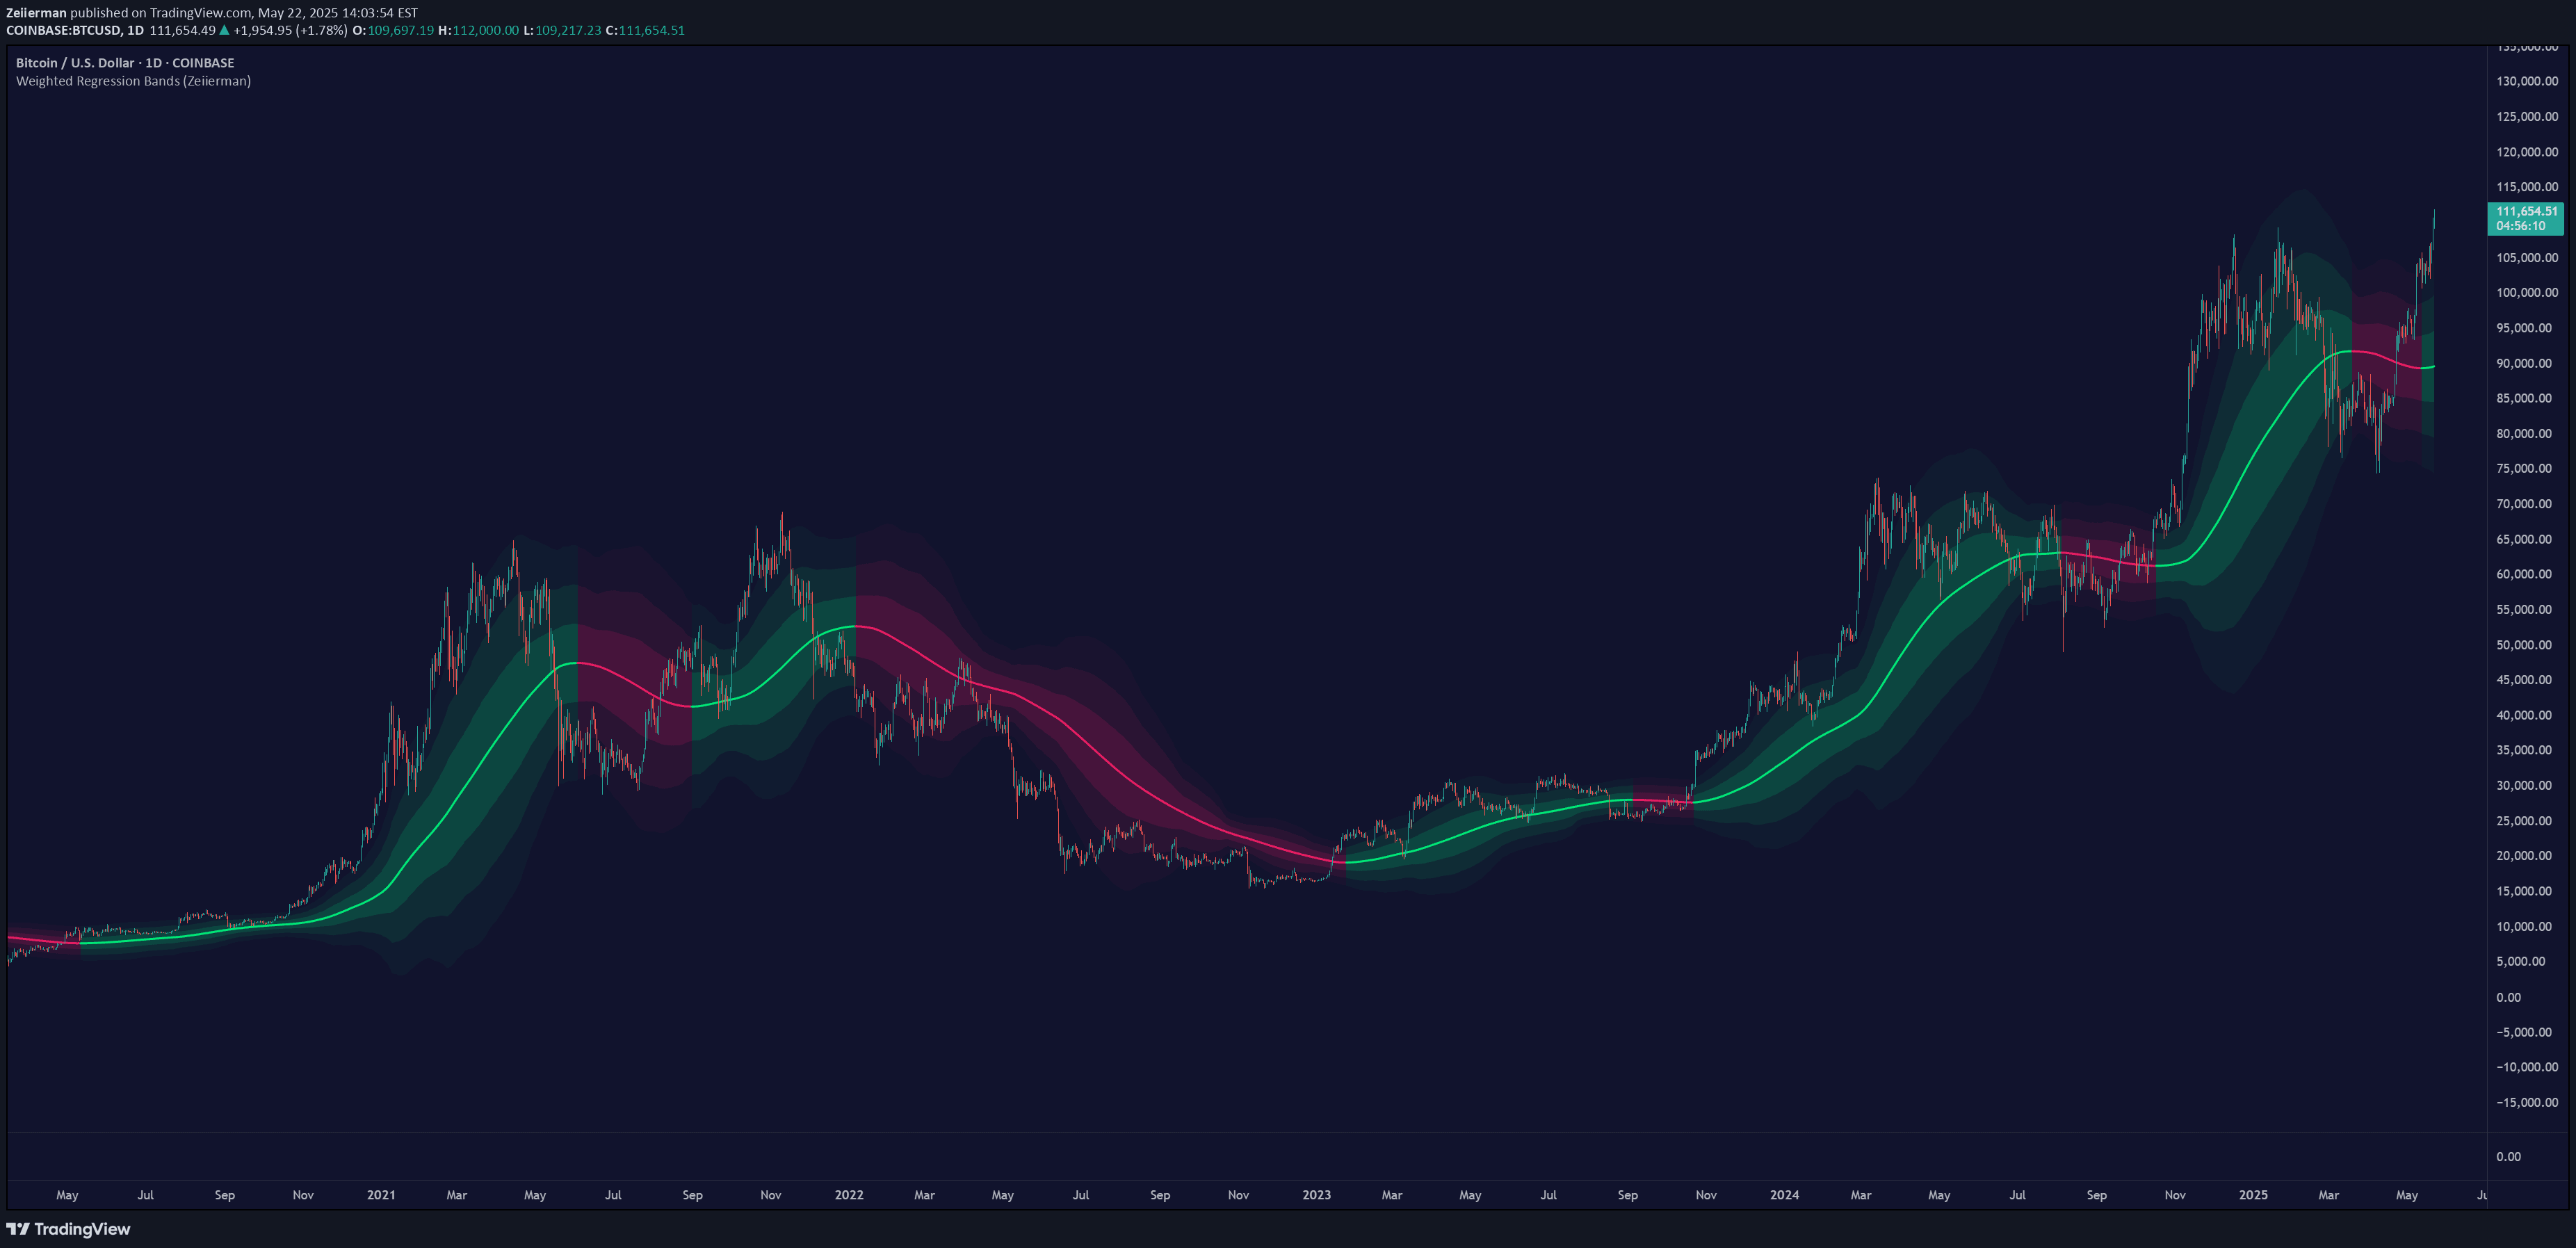
A dynamic kernel regression indicator that smooths price data and creates adaptive bands to identify trend direction, volatility, and potential market reversals with customizable settings.
Explore complementary indicator rolesHow it works
The Multi-Kernel Regression Bands utilize advanced kernel regression techniques to smooth price data, creating a flexible trend line that adapts to market conditions. By selecting from multiple kernel types like Gaussian or Epanechnikov, the indicator calculates a smoothed price representation that reduces noise and highlights underlying price movement.
The indicator then generates dynamic upper and lower bands around this regression line using various deviation methods such as standard deviation, mean absolute deviation, or true range. Traders can customize the band width with a multiplier, allowing the indicator to adjust to different market volatility levels and capture price dynamics across various timeframes.
Why it may be useful
The Multi-Kernel Regression Bands provide traders with a sophisticated tool for understanding market trends and volatility dynamics that goes beyond traditional moving averages. By offering multiple kernel types and deviation calculations, the indicator offers unprecedented flexibility in analyzing price movement, helping traders identify potential trend reversals and market states more accurately.
The adaptive nature of the bands allows traders to gain insights into market conditions across different assets and timeframes. The customizable color modes and signal logic enable traders to quickly interpret market states, making complex statistical analysis more accessible and visually intuitive for decision-making.
When to explore it
The Multi-Kernel Regression Bands are most effective in markets with clear trend characteristics, such as forex, stocks, and cryptocurrencies with moderate to high liquidity. They work exceptionally well in trending markets where price demonstrates consistent directional movement, allowing traders to capture sustained price moves and identify potential trend continuation or reversal points.
Traders should consider using this indicator during periods of stable market conditions and avoid relying solely on it during extreme volatility or fundamental news events. It is particularly useful for traders seeking a more nuanced approach to trend analysis that goes beyond traditional moving average techniques and provides deeper insights into price dynamics.
Keep exploring
What we’ve verified
Access, alerts and repainting behaviour have not been independently verified for this indicator. Check the creator’s current publication and settings.
General descriptions and classifications are recovered research. Verified details above identify the specific checks we have completed. Check the creator’s current publication for later changes.