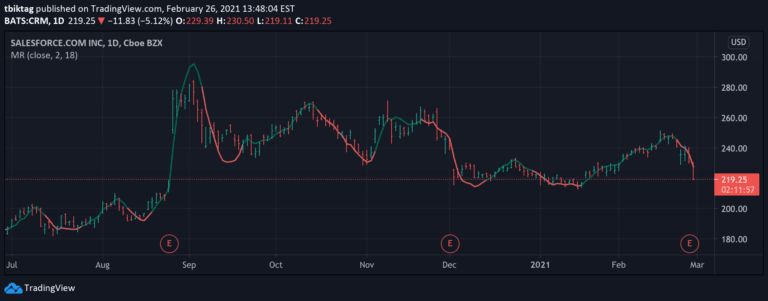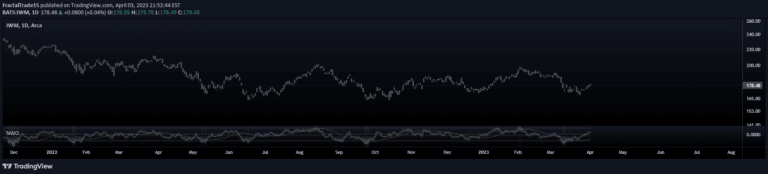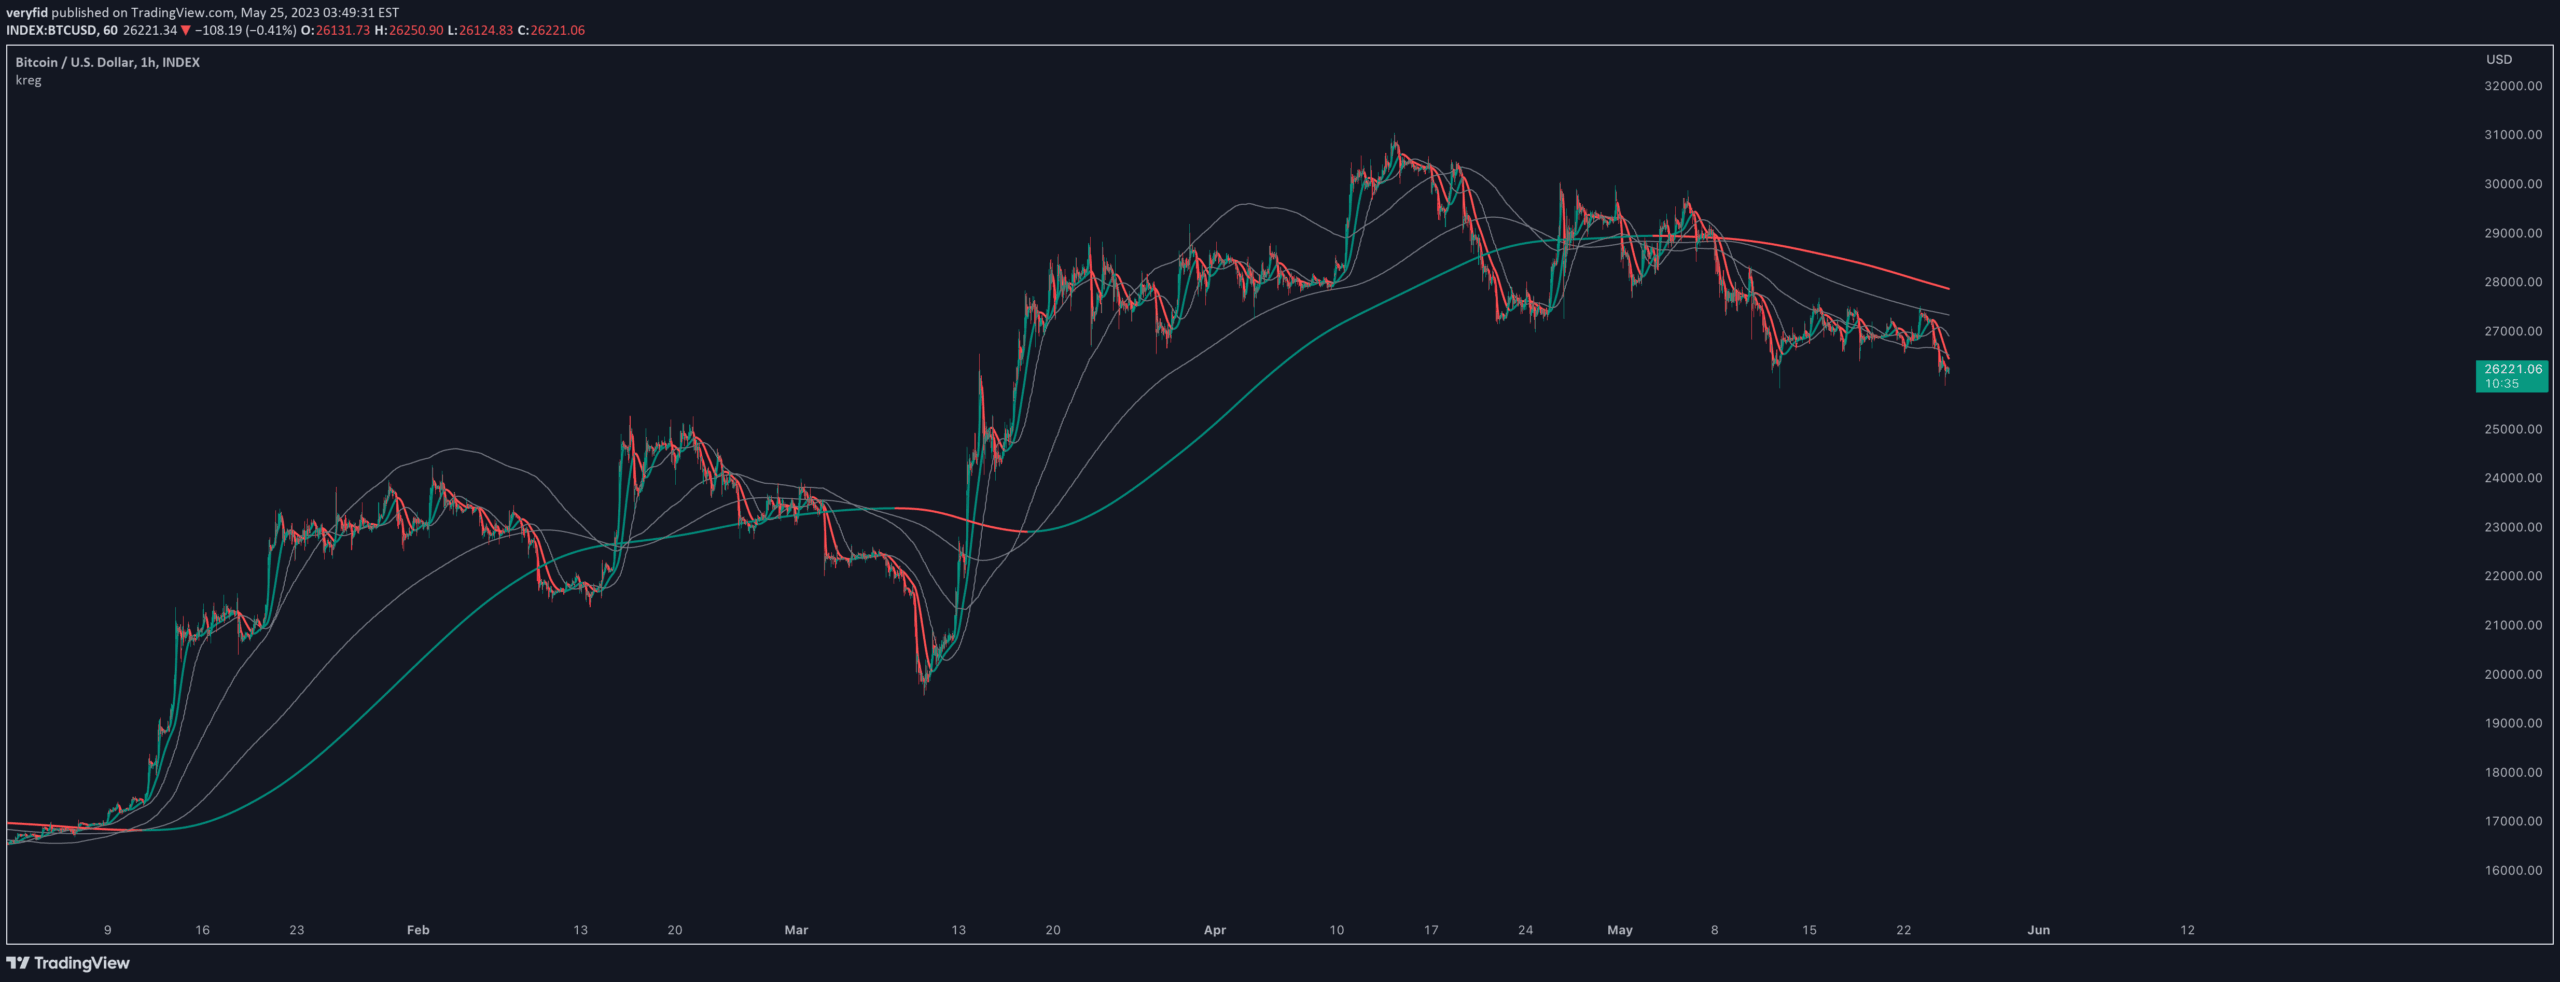
A flexible Nadaraya-Watson kernel estimation toolkit that provides advanced regression line analysis with customizable filters, J lines, and blending capabilities for trend identification and trading signals.
Explore complementary indicator rolesHow it works
The Kreg toolkit uses a Nadaraya-Watson kernel estimation method to generate regression lines and trend indicators. It calculates non-repainting trend lines by applying a sliding window analysis across recent historical price data.
The toolkit allows traders to adjust key parameters like lookback window, weighting, and level to customize the regression line's sensitivity. By incorporating smoothing and zero lag formulas, the tool provides a more refined trend analysis method. The system can generate J lines and blend lines, offering additional insights into price movement and trend characteristics
Why it may be useful
Traders benefit from this toolkit's flexible and customizable approach to trend analysis. By providing multiple regression line options and advanced filtering techniques, it helps identify market trends more accurately. The ability to adjust parameters allows traders to adapt the indicator to different market conditions and trading styles.
The toolkit's non-repainting nature ensures more reliable signals compared to traditional trend indicators. Its versatility enables traders to experiment with various trend detection methods and develop more sophisticated trading strategies
When to explore it
This toolkit works best in markets with clear trend movements and moderate volatility. Traders should use it when seeking a more nuanced approach to trend identification beyond traditional moving averages. It is particularly effective during swing trading and day trading scenarios where precise trend detection is crucial.
The tool is most valuable when traders want to customize their trend analysis and experiment with different regression line configurations. It performs well across multiple asset classes, including stocks, forex, and cryptocurrencies
Keep exploring
What we’ve verified
Access, alerts and repainting behaviour have not been independently verified for this indicator. Check the creator’s current publication and settings.
General descriptions and classifications are recovered research. Verified details above identify the specific checks we have completed. Check the creator’s current publication for later changes.