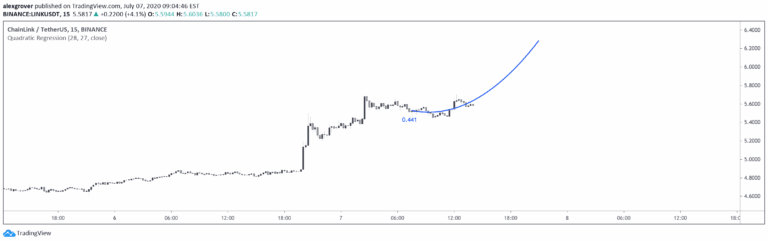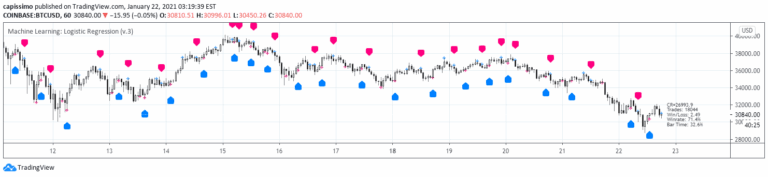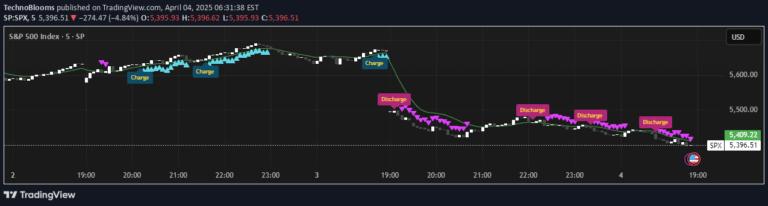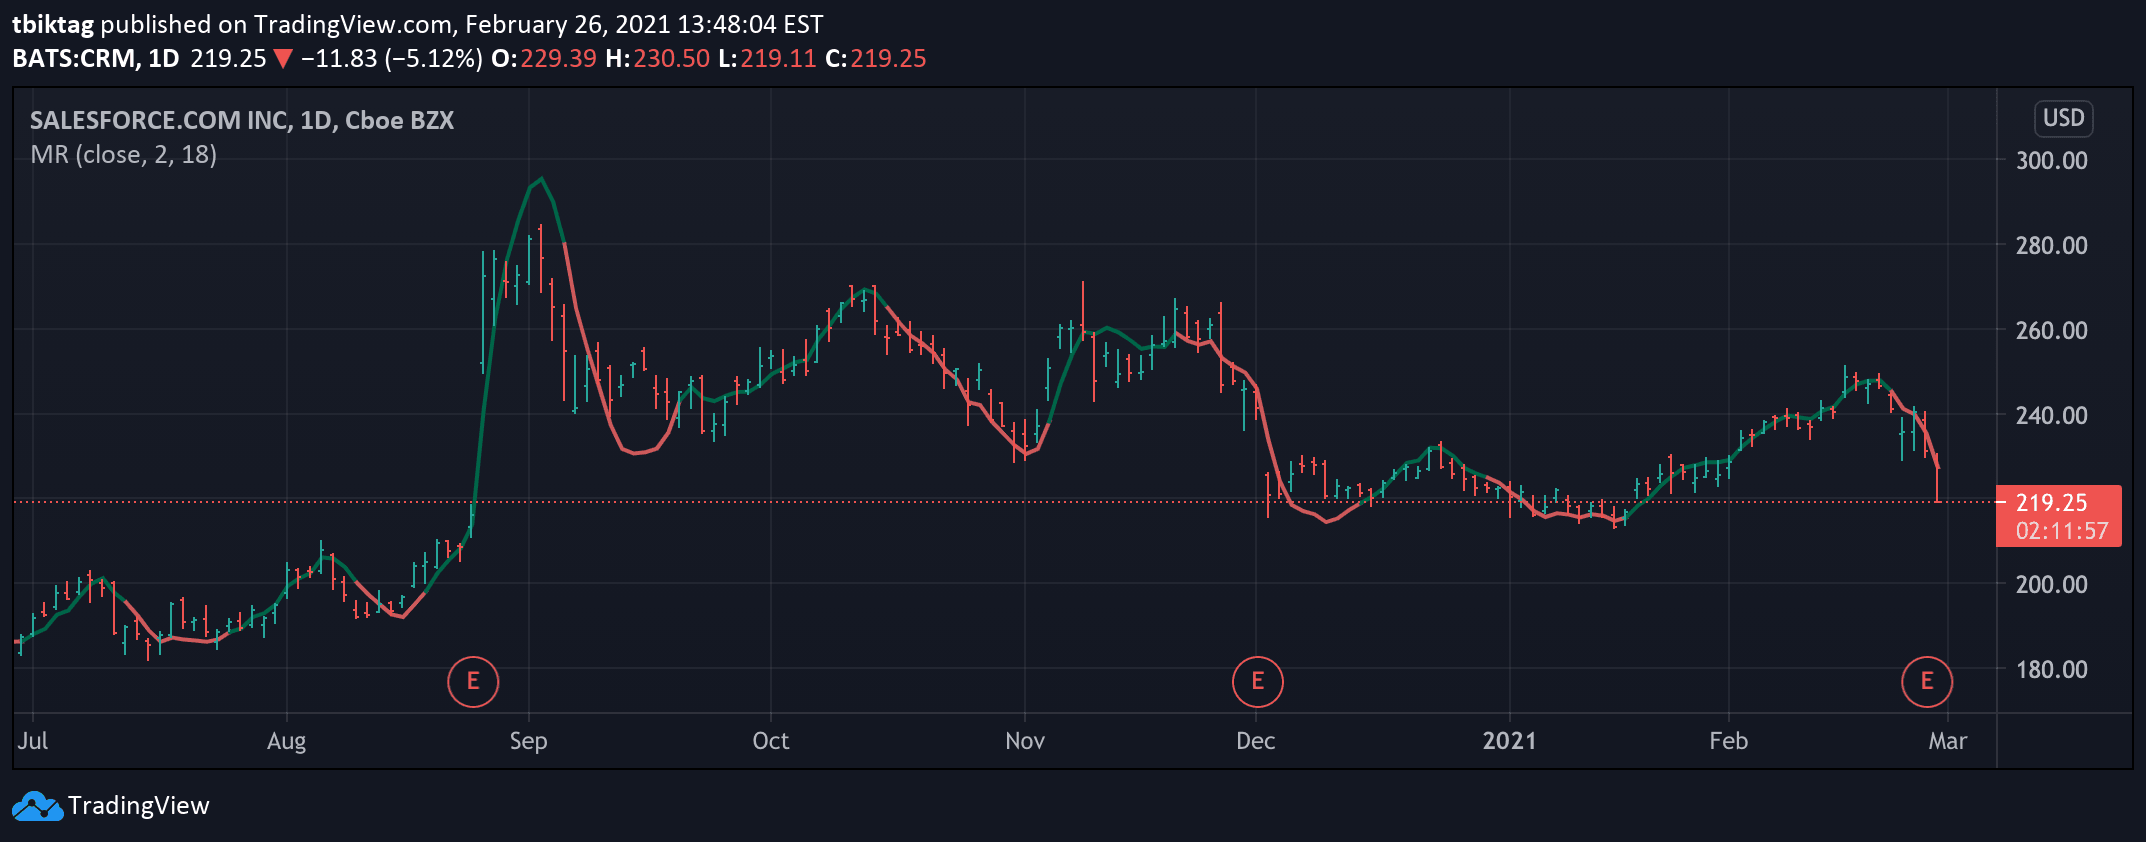
Moving Regression is a flexible trend analysis method that approximates data points using polynomial functions to smooth noise, assess momentum, and predict trend direction.
Explore complementary indicator rolesHow it works
Moving Regression works by approximating a specified number of prior data points using a polynomial function of a user-defined degree. The method fits a local polynomial regression to a moving window of data points, which allows for flexible trend analysis. By adjusting the length of the moving window and the polynomial degree, traders can control the smoothness and responsiveness of the indicator.
The technique interpolates the last data point to construct a time series that can reveal underlying trend characteristics. Higher window lengths and lower polynomial degrees create smoother trends, while shorter windows and higher degrees capture more immediate price changes
Why it may be useful
Moving Regression provides traders with a sophisticated tool for trend analysis that goes beyond traditional moving averages. By using polynomial regression, it can capture more complex price movements and reduce market noise. The indicator helps traders identify trend direction, potential reversals, and areas of support and resistance.
Its flexibility allows customization to different market conditions and trading styles. The ability to predict trend direction through color-coding enhances visual interpretation. Traders can gain deeper insights into market dynamics by adjusting the polynomial degree and window length to match their specific trading strategy and market characteristics
When to explore it
Moving Regression is most effective in markets with clear trend patterns and moderate volatility. It works best for traders seeking a nuanced view of price trends beyond simple moving averages. The indicator is particularly useful when analyzing longer-term price movements in swing trading and day trading scenarios.
Traders should apply it when they want to smooth out short-term price fluctuations and focus on underlying trend momentum. It is especially valuable in trending markets where identifying support, resistance, and potential trend reversals is crucial. The method is adaptable across different financial instruments and can be tailored to various trading timeframes
Keep exploring
What we’ve verified
Access, alerts and repainting behaviour have not been independently verified for this indicator. Check the creator’s current publication and settings.
General descriptions and classifications are recovered research. Verified details above identify the specific checks we have completed. Check the creator’s current publication for later changes.