WaveTrend 3D
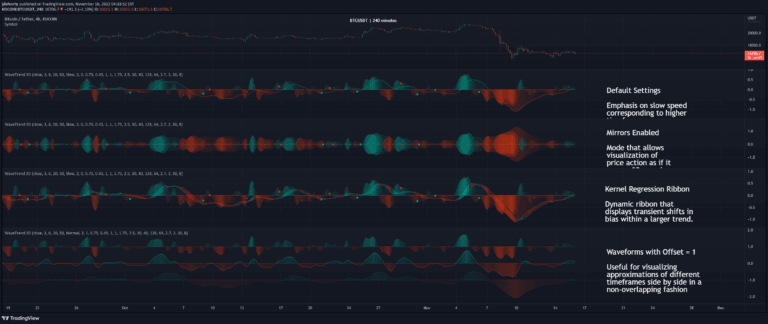
WaveTrend 3D is an advanced oscillator that uses digital signal processing and machine learning techniques to analyze price trends with enhanced precision and multi-timeframe support.
Explore 11,183 indicators. Filter beyond the obvious.
Discover the tools that fit the way you trade.
11,183 tools to explore
WaveTrend 3D is an advanced oscillator that uses digital signal processing and machine learning techniques to analyze price trends with enhanced precision and multi-timeframe support.
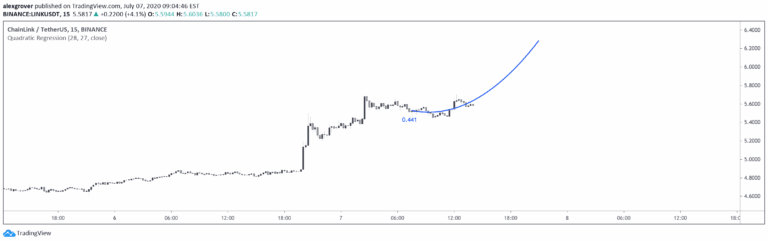
A quadratic regression indicator that fits a parabolic curve to price data, allowing traders to analyze non-linear trends and potentially forecast future price movements.
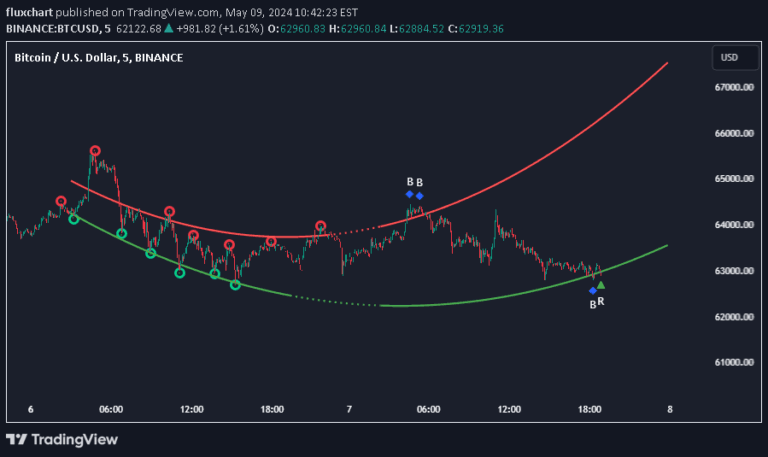
A dynamic support and resistance indicator using polynomial regression to identify price pivot points and potential trend reversal zones with customizable complexity.
Advanced machine learning trading strategy utilizing signal processing techniques and custom moving averages to generate precise housing market trading signals and performance metrics.
A volume profile indicator that analyzes volume distribution across price levels by breaking down price ranges into grids and proportionally attributing volume from lower timeframes.
An advanced Elder Force Index using rational quadratic kernel smoothing to measure price movement strength by combining price change and volume with enhanced analytical precision.
A machine learning-powered trend line indicator that identifies unique support and resistance levels using advanced computational techniques, enhancing traditional technical analysis methods.
A discrete Fourier transform overlay that analyzes market trends by decomposing price data into frequency components, offering insights into market periodicities and directional movements.
An advanced momentum indicator using Rational Quadratics to analyze trend strength, visualize potential movement zones, and generate multiple momentum signals across different market conditions.
An advanced indicator that uses moving average derivatives to predict price movement through acceleration and slope analysis, creating predictive parabolic models for future price trends.
SPTS is a comprehensive statistical trading package offering advanced mathematical functions including t-tests, correlations, regressions, and distribution analysis for traders seeking deeper quantitative insights.
Kernel Regression Ribbon is an advanced trend identification tool using multiple kernel regressions to visualize support, resistance, and price movement adaptively.
Likes, views, and comments are historical TradingView snapshots. They describe attention, not trading performance.