
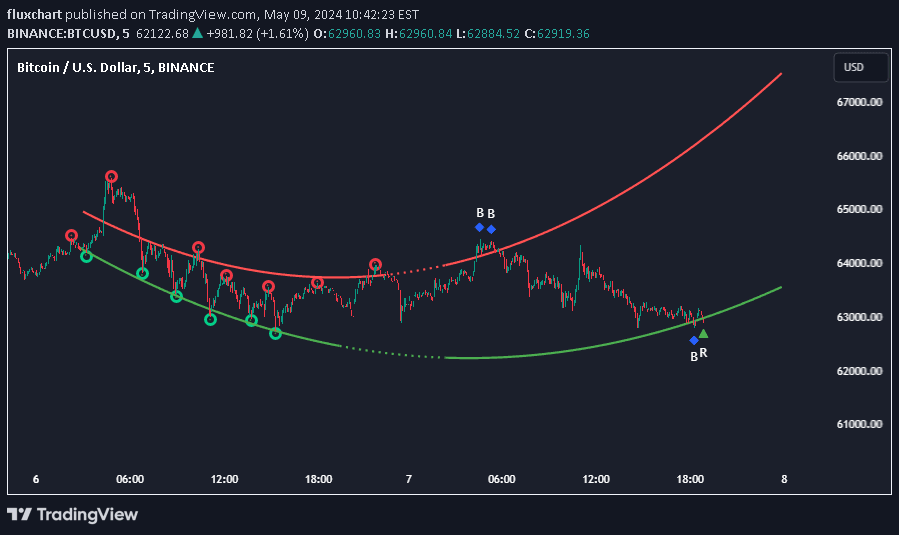
A dynamic support and resistance indicator using polynomial regression to identify price pivot points and potential trend reversal zones with customizable complexity.
Explore complementary indicator rolesHow it works
The polynomial regression support and resistance indicator identifies key pivot points in price movement by analyzing local maximum and minimum price levels. It uses advanced mathematical regression techniques to create flexible trend lines that adapt to price fluctuations, allowing traders to understand potential trend reversal zones.
By selecting specific left and right points on a chart, traders can calculate best-fit resistance and support lines using different polynomial degrees like linear, quadratic, or custom regression. The script plots these dynamic lines, which can curve and adjust based on the selected data points, providing a more nuanced view of potential price movements.
Why it may be useful
Traditional support and resistance lines often fail to capture the complexity of price movements, which can include consecutive higher highs, lower lows, or mixed patterns. This polynomial regression approach offers a more sophisticated method of identifying potential trend reversals by creating adaptable lines that reflect the true variance in price data.
By allowing traders to customize the regression complexity, the indicator provides flexibility in analyzing different market conditions and timeframes. The ability to choose between linear, quadratic, cubic, or custom polynomial regressions enables more precise trend analysis and helps traders make more informed decisions about potential price movements.
When to explore it
This indicator works best in markets with complex, non-linear price movements where traditional horizontal support and resistance lines prove insufficient. It is particularly useful in volatile markets or during periods of significant price fluctuations where simple linear models cannot capture the nuanced price behavior.
Traders should exercise caution and avoid overfitting by not making the polynomial regression too complex. The ideal use is when seeking a balance between capturing meaningful price trends and maintaining a generalizable model that can predict future price movements without becoming too closely tied to historical data.
Keep exploring
What we’ve verified
Access, alerts and repainting behaviour have not been independently verified for this indicator. Check the creator’s current publication and settings.
General descriptions and classifications are recovered research. Verified details above identify the specific checks we have completed. Check the creator’s current publication for later changes.


