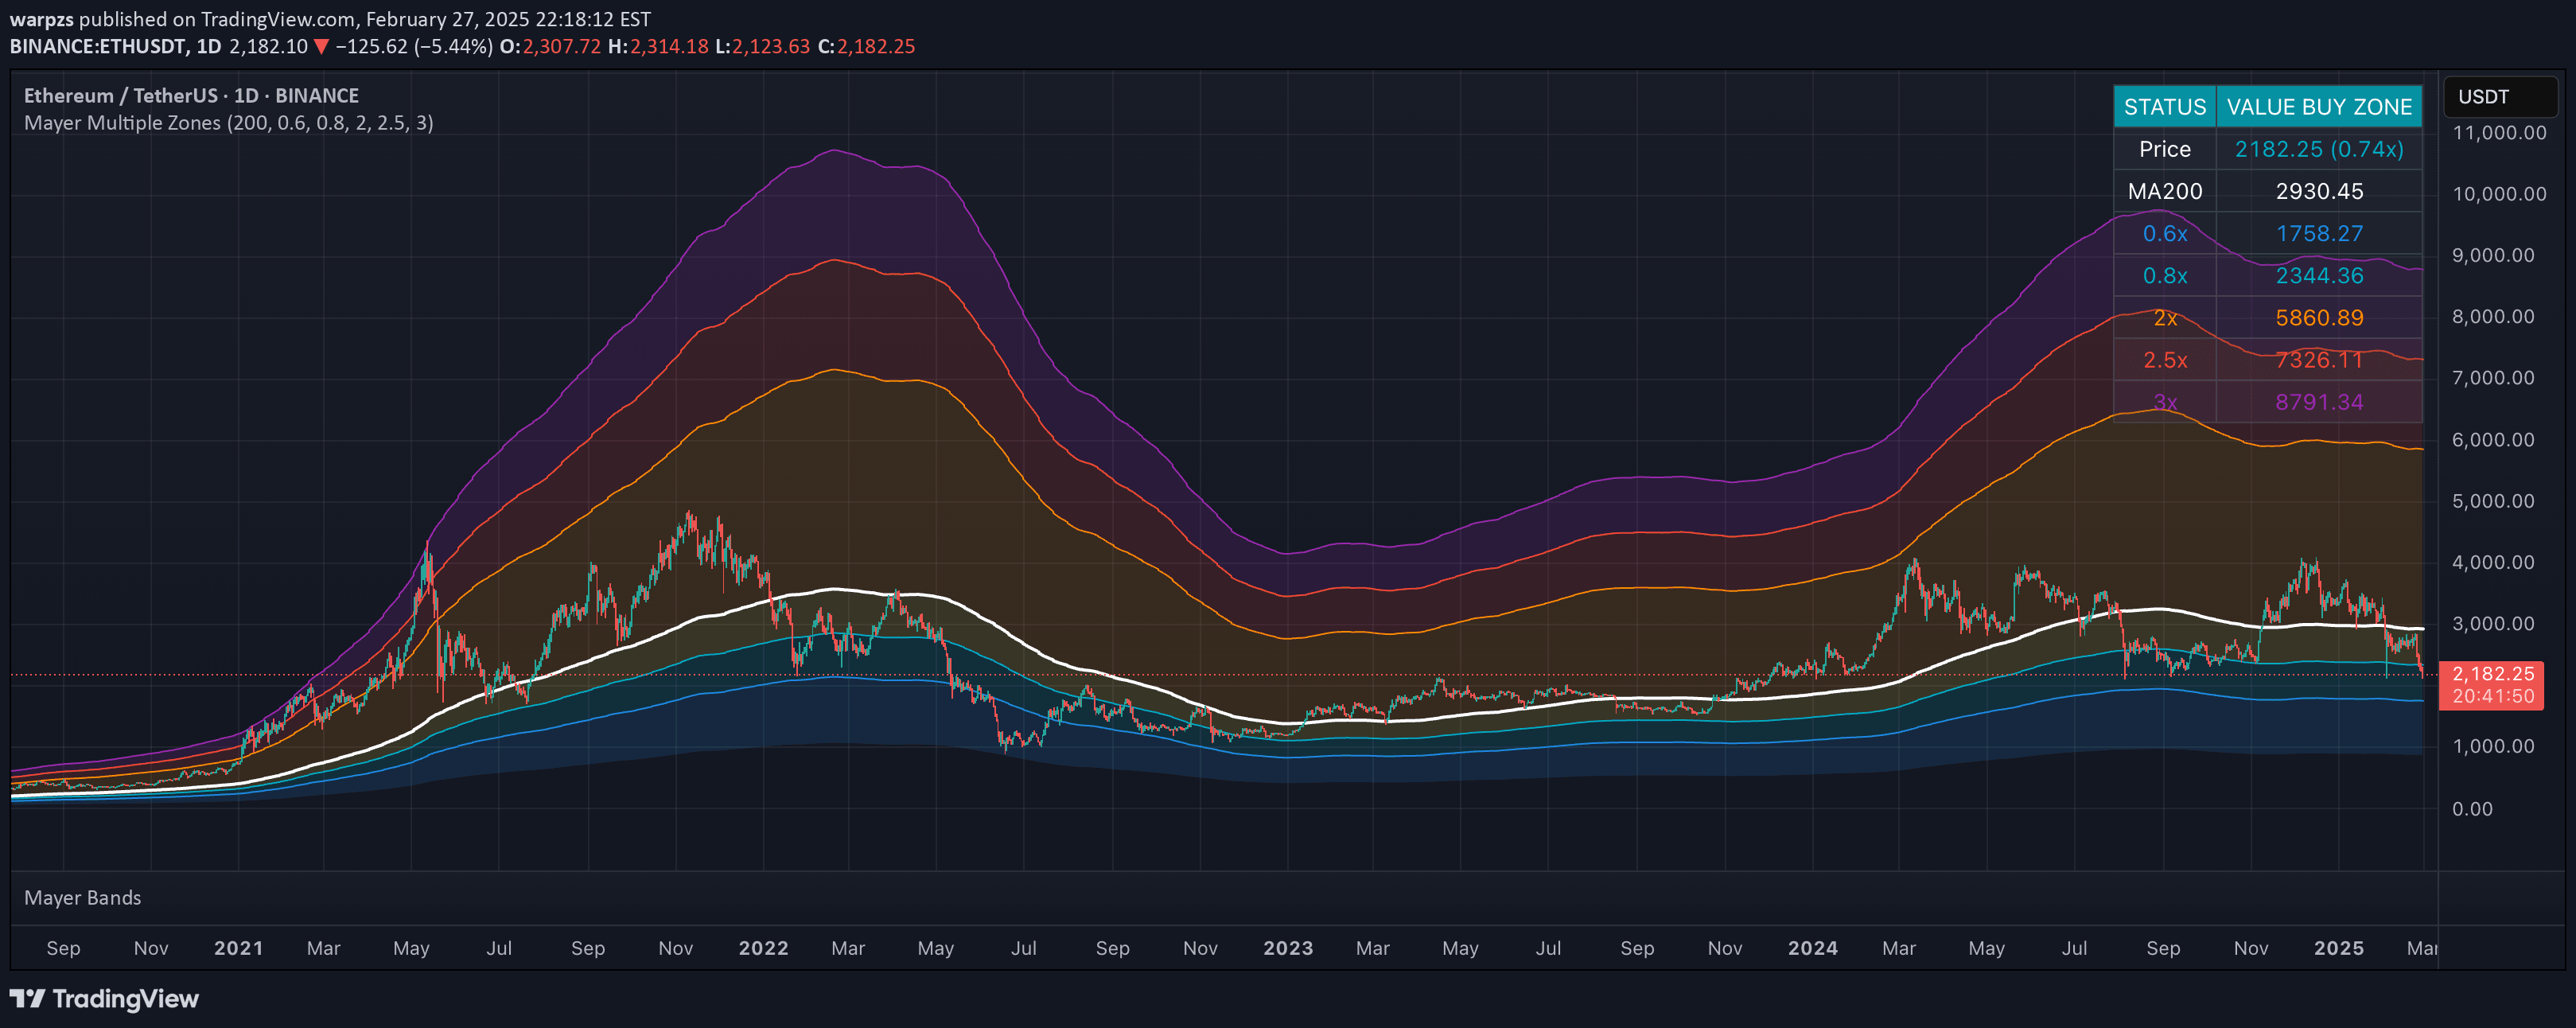
A logarithmic regression indicator for Ethereum designed to estimate long-term price trends using customizable bands that track price movement across different historical periods.
Explore complementary indicator rolesHow it works
The Ethereum Logarithmic Regression Bands indicator uses a logarithmic regression model to create a dynamic trend analysis tool specifically tailored for ETH/USD. By fitting a trend line to historical price data, the indicator generates a central regression line along with upper and lower bands that represent potential price ranges.
Traders can adjust parameters like launch price, base coefficient, and growth coefficient to customize the bands. The indicator operates on a weekly timeframe in logarithmic view, providing a visual representation of Ethereum's long-term price trajectory and potential support and resistance levels.
Why it may be useful
This indicator is valuable for traders seeking to understand Ethereum's long-term price trends and potential future movement patterns. By providing a logarithmic view of price action, it helps traders identify broader market trends and potential areas of price consolidation or expansion beyond short-term market noise.
The customizable nature of the bands allows traders to experiment with different historical fitting approaches, potentially revealing insights into Ethereum's price behavior that might not be immediately apparent through traditional linear analysis methods.
When to explore it
The Ethereum Logarithmic Regression Bands are most effective for swing traders and long-term investors interested in understanding Ethereum's macro price trends. It is particularly useful during periods of significant market movement or when evaluating potential long-term investment strategies.
Traders should use this indicator in conjunction with other technical and fundamental analysis tools, recognizing that it provides a generalized trend estimation rather than precise predictive signals. It is most beneficial when applied to weekly or monthly timeframes that capture broader market dynamics.
Keep exploring
What we’ve verified
Access, alerts and repainting behaviour have not been independently verified for this indicator. Check the creator’s current publication and settings.
General descriptions and classifications are recovered research. Verified details above identify the specific checks we have completed. Check the creator’s current publication for later changes.