A market valuation indicator using the 200-period moving average to categorize price into strategic zones, helping traders identify potential buying and selling opportunities.
Explore complementary indicator rolesHow it works
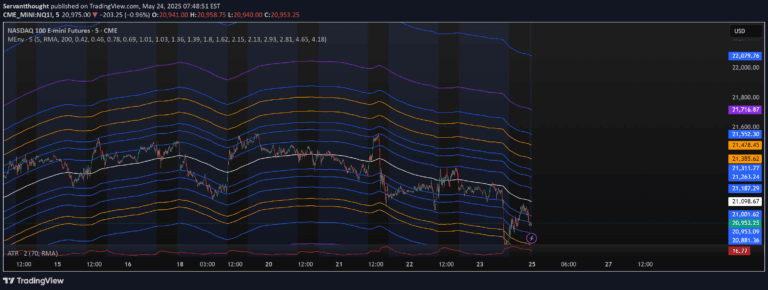
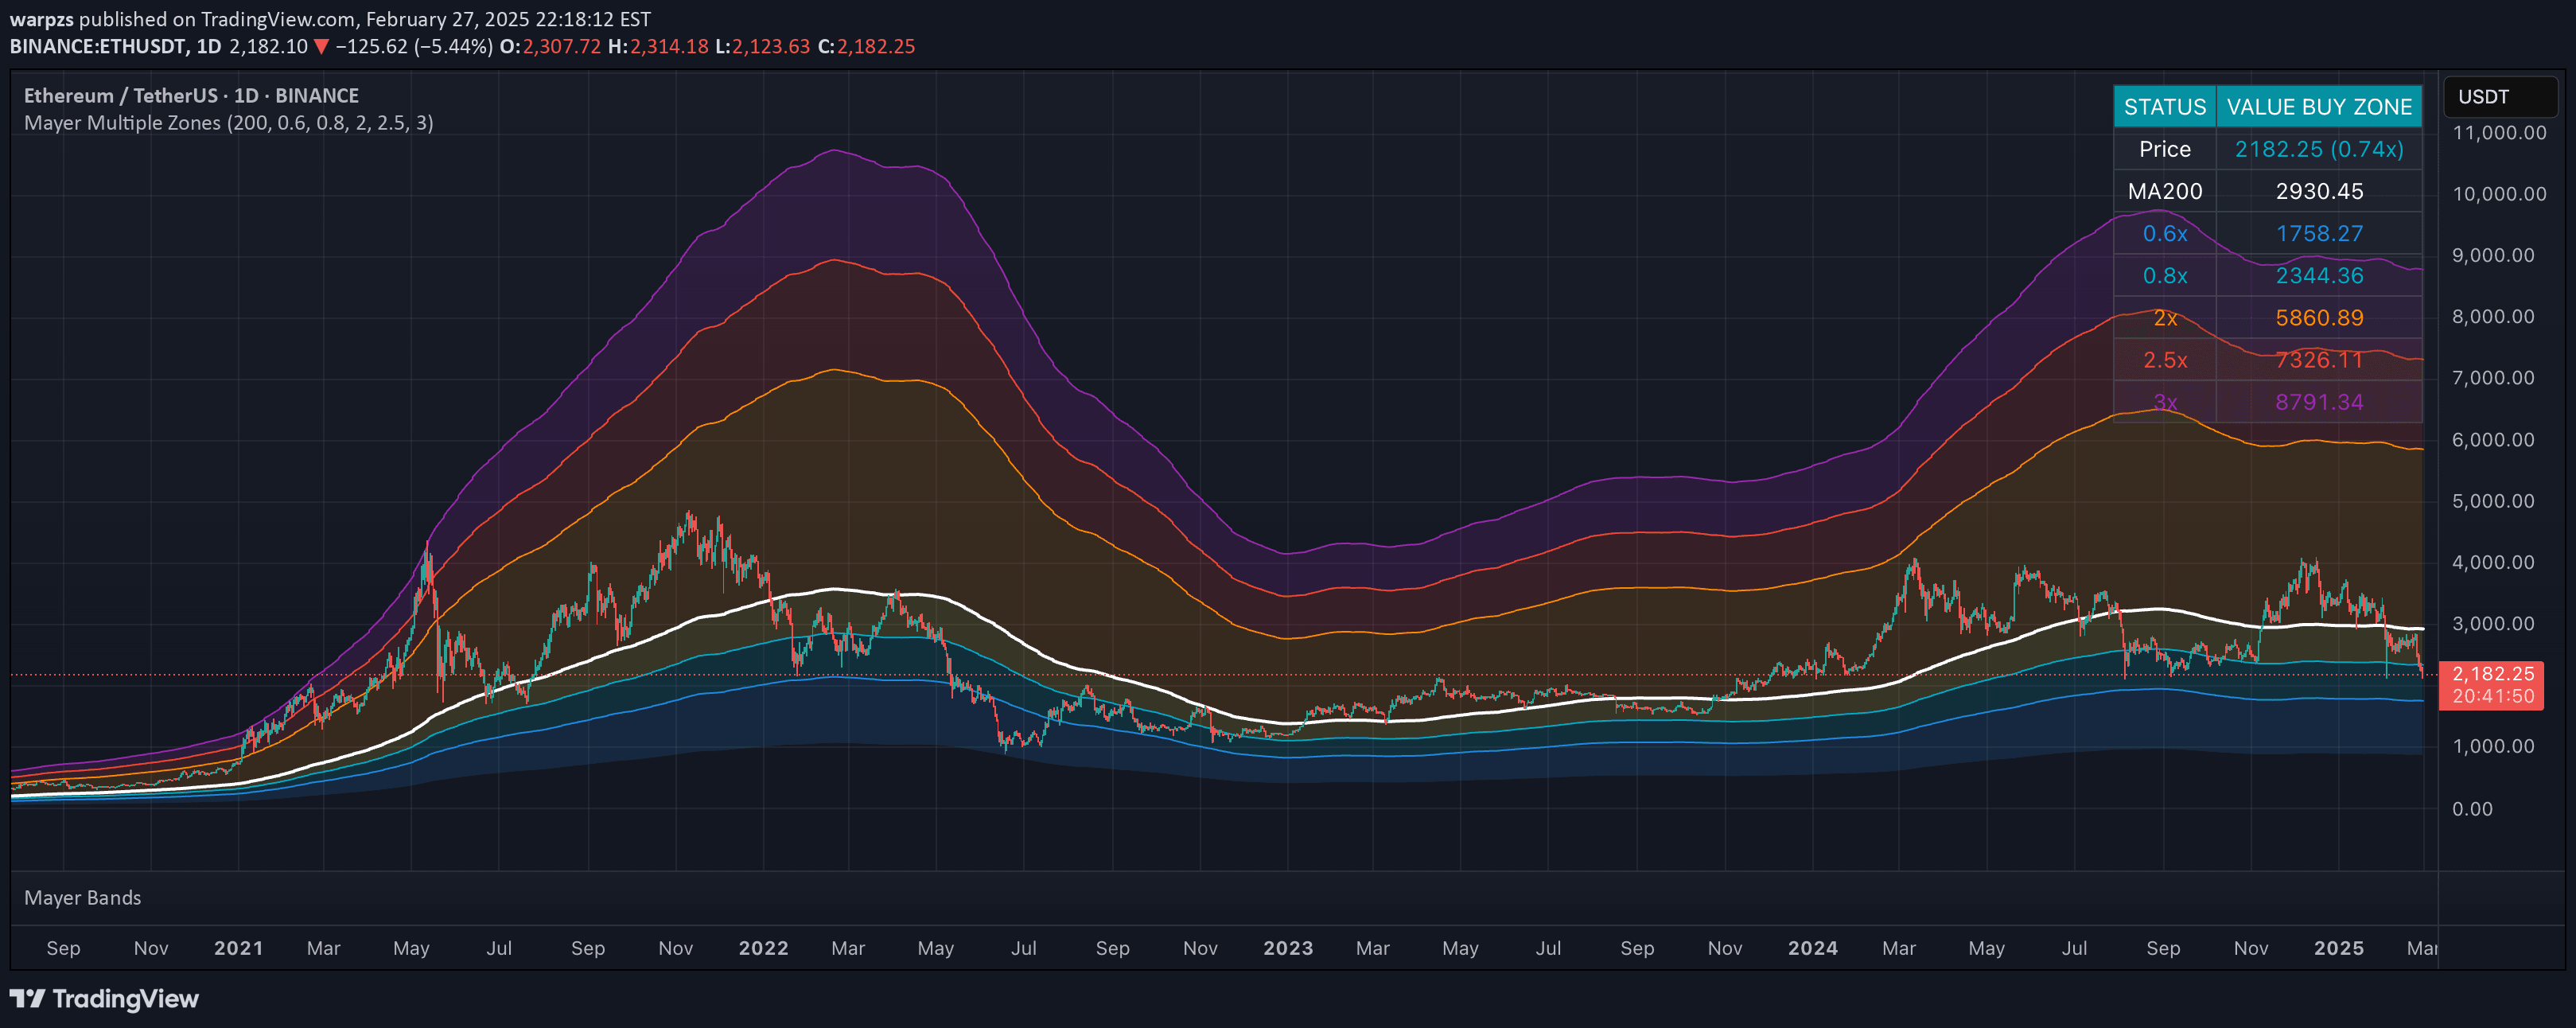
The Mayer Multiple Zones indicator calculates price zones relative to the 200-period moving average, dividing market valuation into six distinct categories. By using predefined multipliers of the MA200, the indicator creates color-coded zones ranging from strong buy to bubble territory, allowing traders to quickly assess current market conditions.
Each zone represents a different stage of market valuation, with thresholds typically defined as multiples of the moving average. Traders can customize these multipliers to suit specific market characteristics, enabling a flexible approach to understanding price positioning and potential market movements.
Why it may be useful
The Mayer Multiple Zones indicator provides traders with a comprehensive view of market valuation, helping them make more informed trading decisions based on historical price patterns. By offering a clear, visual representation of price relative to its long-term moving average, traders can quickly identify potential buying opportunities, fair value ranges, and potential market extremes.
This tool is particularly valuable for understanding market psychology and potential trend reversals, as it highlights when an asset might be undervalued or overvalued. The indicator's multi-timeframe compatibility and customizable settings make it a versatile tool for both long-term investors and shorter-term traders seeking strategic market insights.
When to explore it
The Mayer Multiple Zones indicator is most effective in markets with clear trending characteristics and sufficient historical price data to establish meaningful moving average references. It works best when traders want to gain a macro perspective on market valuation, particularly during periods of potential trend changes or when assessing overall market sentiment.
Traders should use this indicator in conjunction with other technical and fundamental analysis tools to confirm signals and validate potential trading opportunities. It is particularly useful for identifying potential entry points during market corrections, understanding long-term value zones, and managing risk by recognizing when an asset might be approaching unsustainable valuation levels.
Keep exploring
What we’ve verified
Access, alerts and repainting behaviour have not been independently verified for this indicator. Check the creator’s current publication and settings.
General descriptions and classifications are recovered research. Verified details above identify the specific checks we have completed. Check the creator’s current publication for later changes.