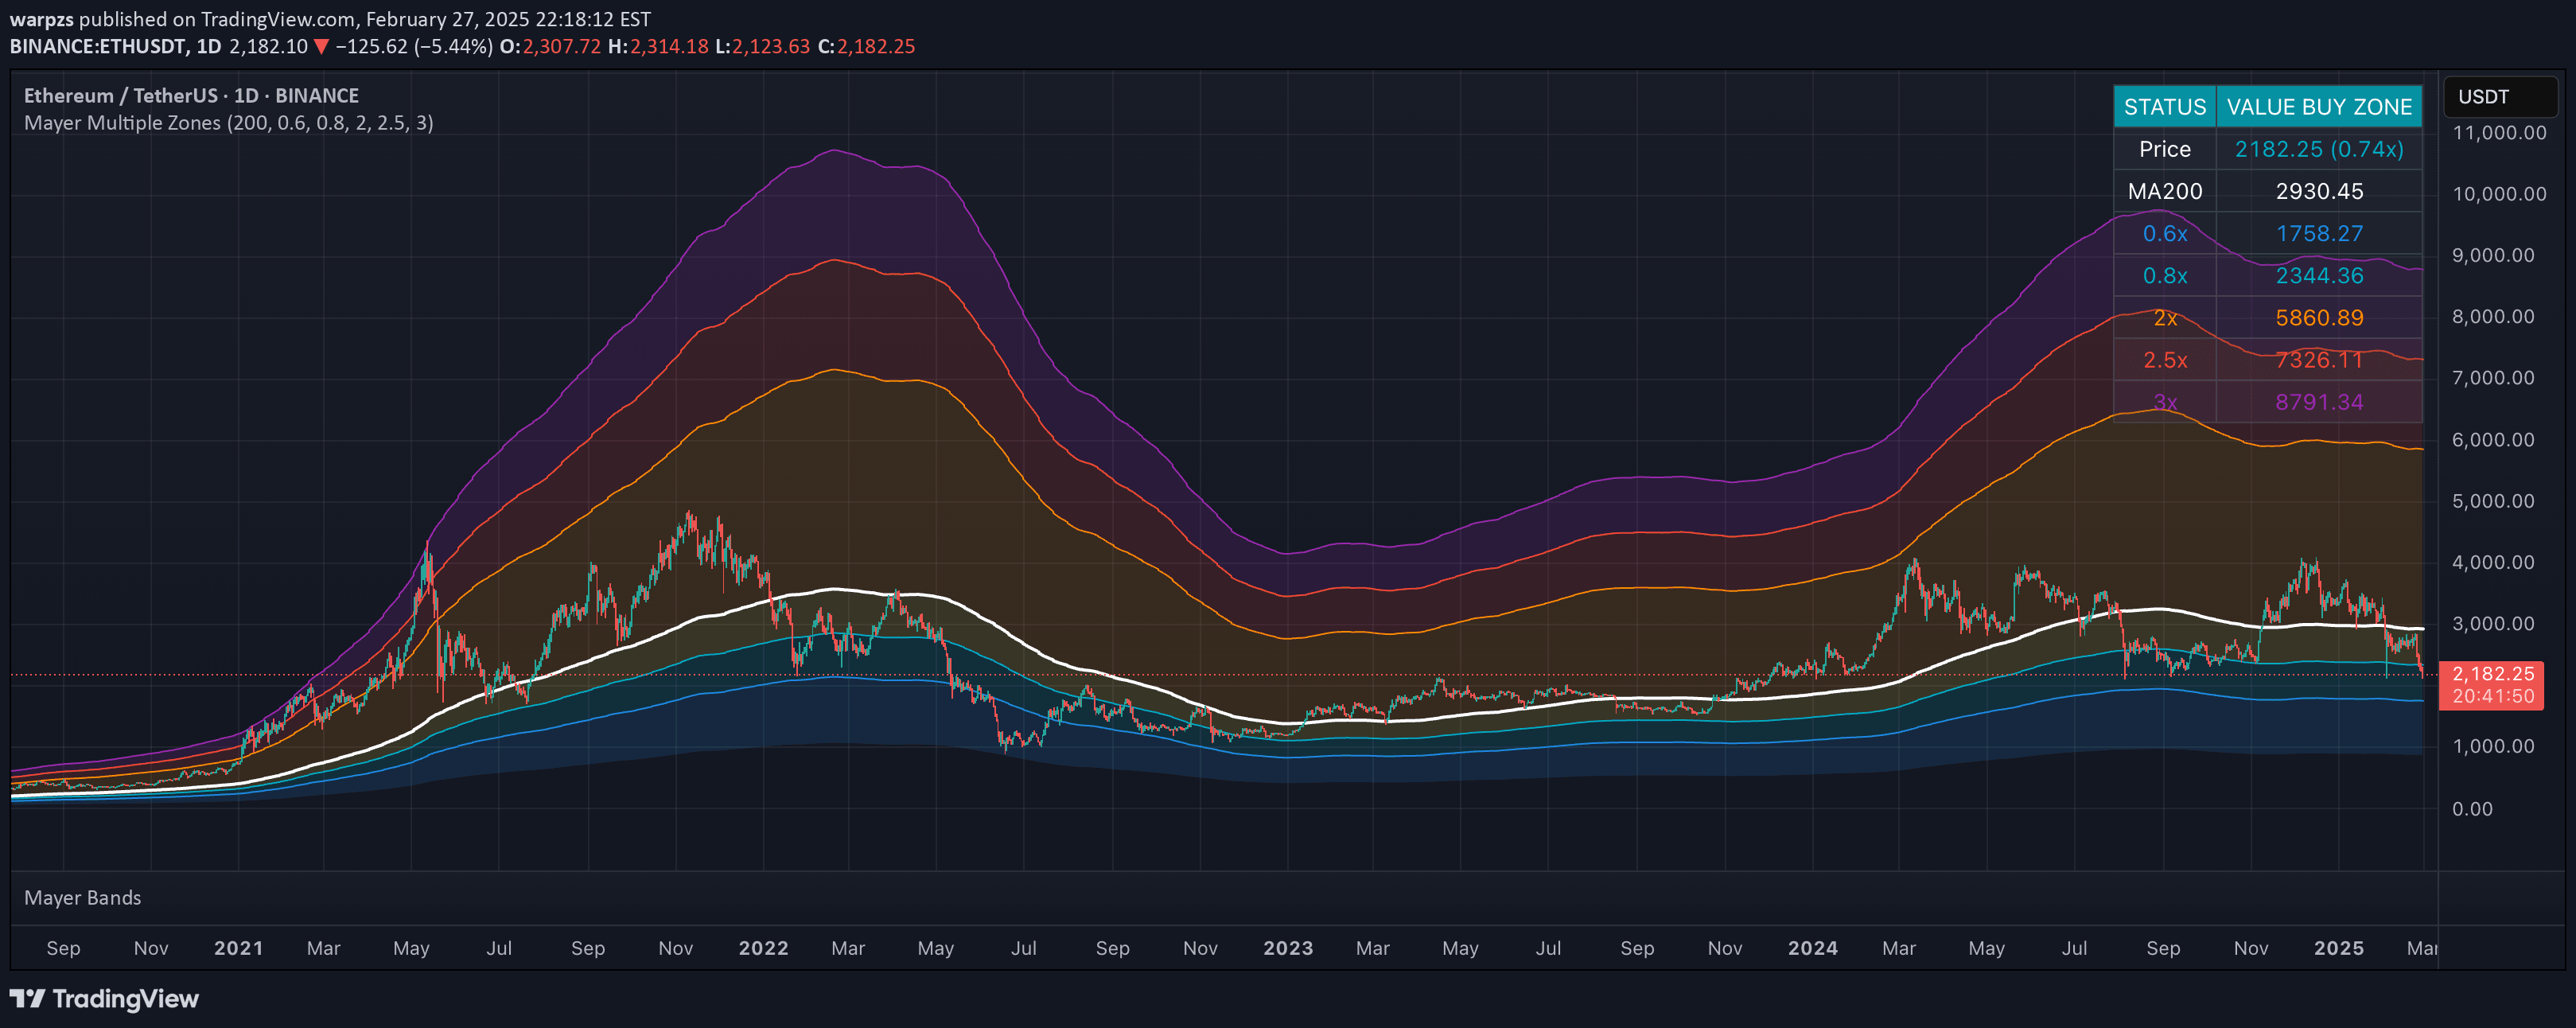
The Mayer Multiple is a trading indicator that compares current price to its 200-day simple moving average, helping traders identify market conditions and potential entry or exit points.
Explore complementary indicator rolesHow it works
The Mayer Multiple calculates the ratio between the current price and its 200-day simple moving average (SMA), creating a dynamic measurement of market valuation. By comparing the current price to its long-term moving average, traders can quickly assess whether an asset is trading above or below its historical trend line.
The indicator establishes multiple threshold zones that help traders understand market sentiment and potential turning points. These zones range from deeply oversold conditions to extremely overbought scenarios, providing a comprehensive view of price behavior relative to its long-term average.
Why it may be useful
The Mayer Multiple offers traders a systematic approach to understanding market valuation and potential entry or exit points based on historical price relationships. By providing clear visual indicators of market conditions, it helps traders make more informed decisions about asset pricing and potential trend reversals.
This tool is particularly valuable for long-term investors and swing traders seeking to understand broader market trends and identify potential opportunities. The indicator's ability to highlight different market zones allows traders to manage risk more effectively and make more strategic investment choices.
When to explore it
The Mayer Multiple is most effective when used in longer-term trading strategies, particularly for assets with established historical price data. It works best in markets with clear trending behavior, where the 200-day moving average provides a reliable baseline for price evaluation.
Traders should utilize this indicator during periods of significant market movement or when seeking to understand the broader context of an asset's price performance. It is especially useful for identifying potential buying opportunities during market corrections or recognizing when an asset might be overvalued or undervalued.
Keep exploring
What we’ve verified
Access, alerts and repainting behaviour have not been independently verified for this indicator. Check the creator’s current publication and settings.
General descriptions and classifications are recovered research. Verified details above identify the specific checks we have completed. Check the creator’s current publication for later changes.