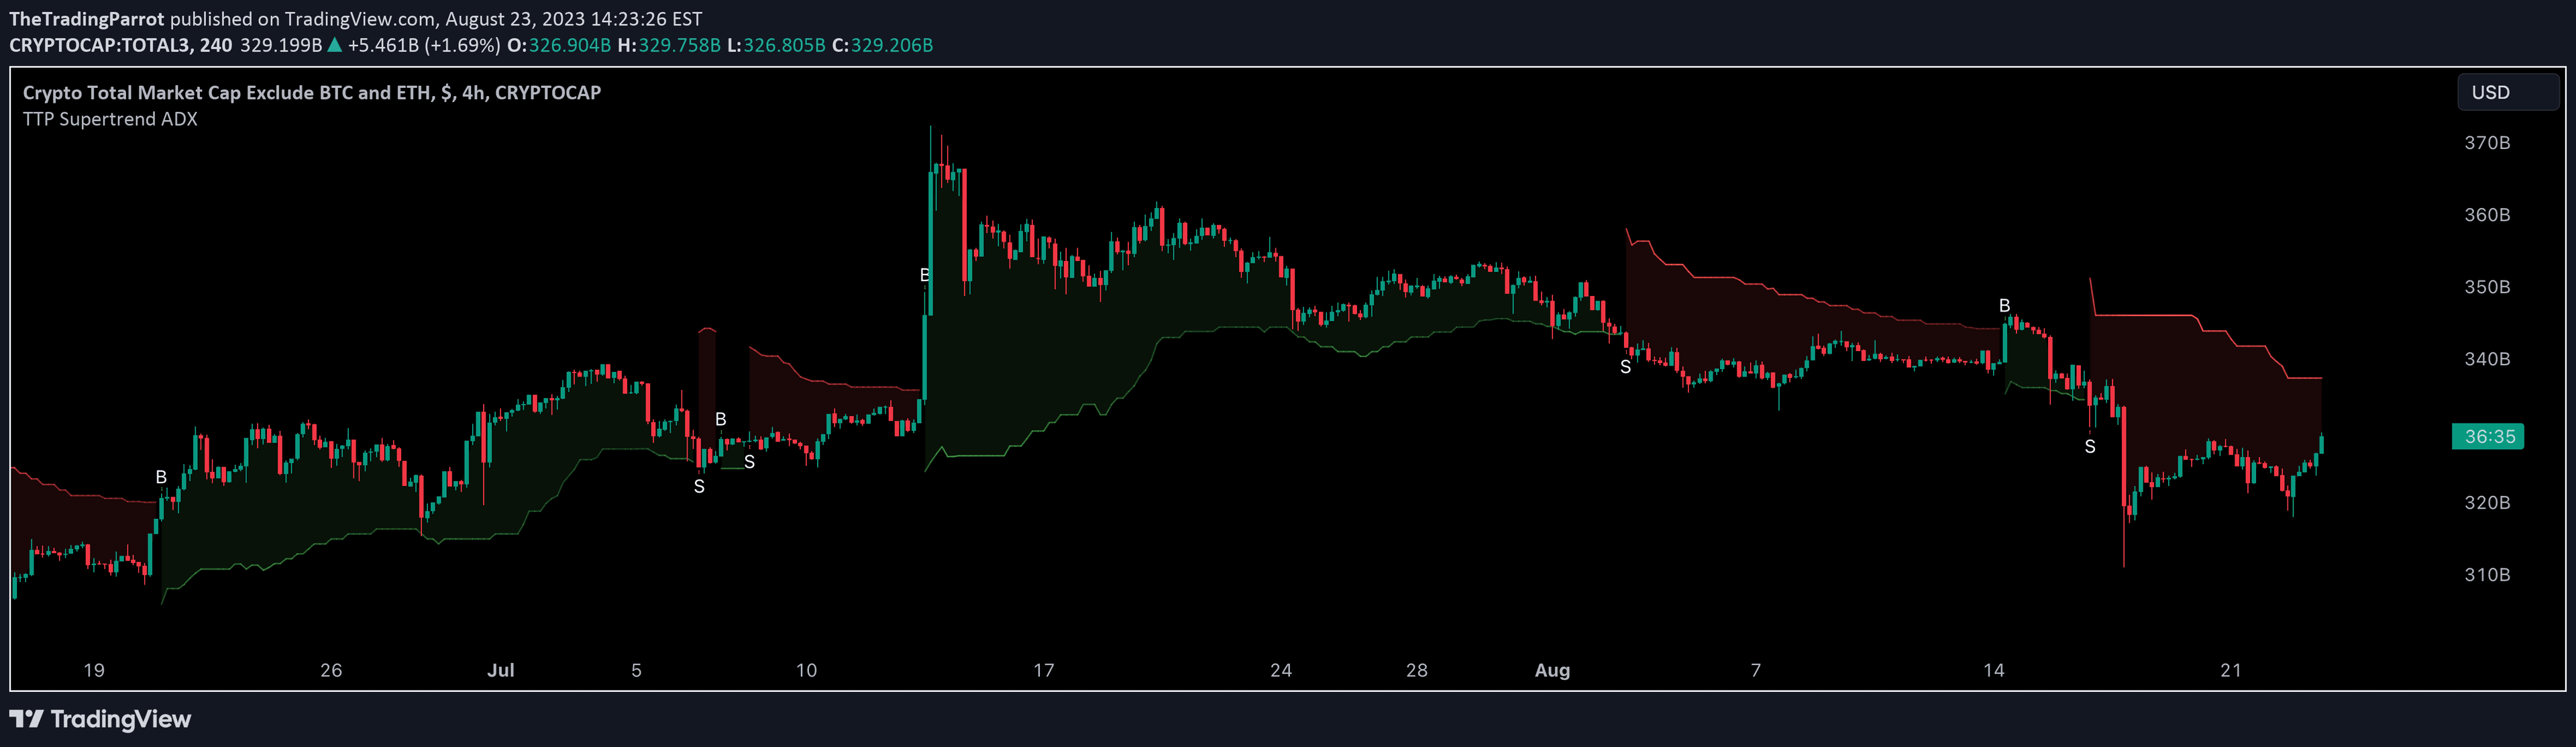
Volatility Layered Supertrend (VLS) is an advanced trend-following indicator that improves traditional Supertrend by providing clearer entry points, trend strength zones, and dynamic profit targets.
Explore complementary indicator rolesHow it works
The Volatility Layered Supertrend (VLS) builds upon the classic Supertrend by introducing multiple trend layers with different multipliers, ranging from short to extra-long term trends. It divides the main long-term trend into 'Weak' and 'Strength' zones, with a dedicated 'Trade Entry Zone' that starts from the mid-point, helping traders identify optimal entry and exit points.
By utilizing Average True Range (ATR), VLS adapts to market volatility and provides color-coded signals (green for uptrends, red for downtrends). The indicator includes Short, Medium, Long, and Extra Long trend layers, which help filter out false signals and provide more precise trade timing across different trend perspectives.
Why it may be useful
Traditional Supertrend indicators often struggle with impractical stop-loss levels and unclear entry points, leaving traders uncertain about trade execution. VLS addresses these limitations by offering a more sophisticated approach that provides clear trend strength indicators and precise trade entry zones.
By incorporating multiple trend layers and dynamically adjusting profit targets, VLS helps traders make more informed decisions, reduce false signals, and align their trading strategy with the underlying market trend. The indicator's volatility-adaptive design ensures that traders can effectively navigate different market conditions with greater confidence and precision.
When to explore it
VLS is most effective in trending markets where clear directional movement is present, allowing traders to capitalize on sustained price momentum. It works exceptionally well in markets with moderate to high volatility, where the multiple trend layers can help filter out noise and provide more reliable signals.
Traders should consider using VLS when they want to identify strong trend directions, need precise entry and exit points, and desire a comprehensive view of market trends across different timeframes. It is particularly useful for traders who want to combine trend analysis with volatility assessment and require a more nuanced approach to trend-following strategies.
Keep exploring
What we’ve verified
Access, alerts and repainting behaviour have not been independently verified for this indicator. Check the creator’s current publication and settings.
General descriptions and classifications are recovered research. Verified details above identify the specific checks we have completed. Check the creator’s current publication for later changes.