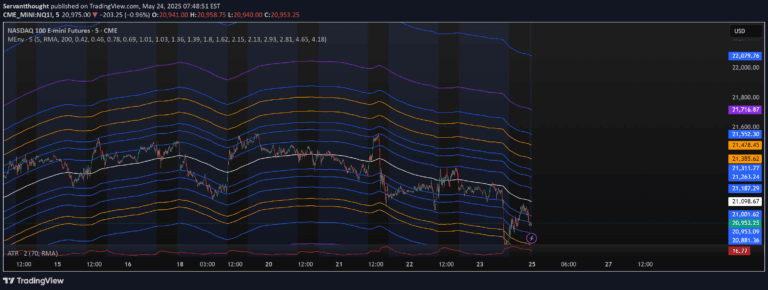
A technical analysis tool using a 2-year moving average to identify long-term market trends and potential overbought or oversold conditions in an asset's price.
Explore complementary indicator rolesHow it works
The 2-Year MA Multiplier calculates a 730-day simple moving average of an asset's closing price, creating a smooth long-term trend line. It then establishes an upper band by multiplying this moving average by five, which serves as a reference point for identifying potential market extremes.
The indicator uses color-coded visual representations to highlight the relationship between the current price and the moving average. When the price crosses above the upper band, it signals potentially overbought conditions in tomato red, while prices falling below the moving average are marked in cornflower blue to indicate potentially oversold conditions.
Why it may be useful
Long-term moving averages provide crucial insights into an asset's fundamental price behavior by smoothing out short-term market noise and volatility. By establishing a reliable baseline, traders can better understand the underlying trend and identify significant market movements that might be missed with shorter-term analysis.
The 2-Year MA Multiplier is particularly valuable for identifying potential market turning points, helping traders recognize when an asset may be overextended or presenting a unique entry opportunity. Its ability to capture major market cycles makes it a powerful tool for understanding broader market dynamics and making more informed investment decisions.
When to explore it
The 2-Year MA Multiplier is most effective when analyzing assets with significant historical price data and those prone to cyclical market behavior, such as cryptocurrencies or major stock indices. It works best for traders interested in long-term trend analysis and those seeking to identify potential market tops and bottoms.
Traders should implement this indicator as part of a comprehensive analysis strategy, using it in conjunction with other technical and fundamental indicators. It is particularly useful for swing traders and investors looking to make strategic entry and exit decisions based on long-term market trends and potential mean reversion opportunities.
Keep exploring
What we’ve verified
Access, alerts and repainting behaviour have not been independently verified for this indicator. Check the creator’s current publication and settings.
General descriptions and classifications are recovered research. Verified details above identify the specific checks we have completed. Check the creator’s current publication for later changes.