RSI cyclic smoothed v2
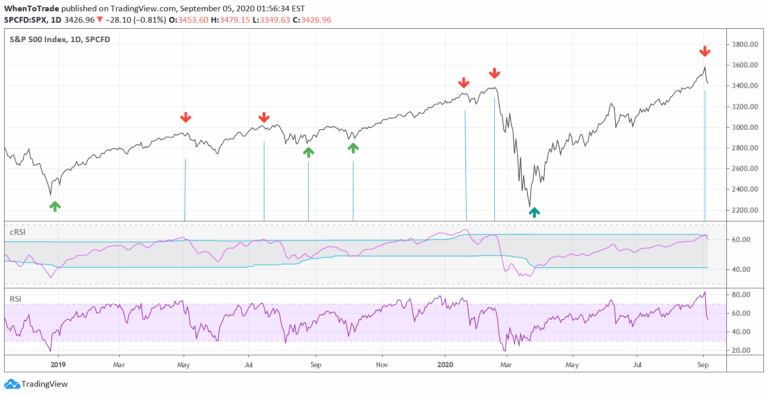
An enhanced RSI indicator that uses cyclic smoothing and adaptive bands to provide more responsive market trend signals by incorporating dominant cycle length.
Explore 11,183 indicators. Filter beyond the obvious.
Discover the tools that fit the way you trade.
11,183 tools to explore
An enhanced RSI indicator that uses cyclic smoothing and adaptive bands to provide more responsive market trend signals by incorporating dominant cycle length.
Global Liquidity Index tracks worldwide central bank balance sheets, providing a comprehensive view of global monetary conditions and potential market trends through consolidated financial data.
A customizable market session tracker displaying trading hours for Tokyo, London, New York, and Sydney with multiple visualization options and advanced trading insights.
Live Economic Calendar tracks global financial news events, providing real-time updates on market-moving events across multiple currencies with impact levels and detailed visualizations.
ICT Algorithmic Macro Tracker plots key trading time windows based on Inner Circle Trader methodology, helping traders identify potential market movement periods across specific time intervals.
A comprehensive Ichimoku trading tool that combines multiple theories to analyze market trends, cycles, waves, and potential price targets using advanced Japanese technical analysis techniques.
Super Pivots is a versatile indicator that displays pivot points across multiple timeframes, helping traders identify key market levels and potential trading opportunities.
A sophisticated market cycle detection method that uses Detrended Price Oscillator to identify rhythmic patterns and dominant cycles in price movements, helping traders optimize technical indicator settings.
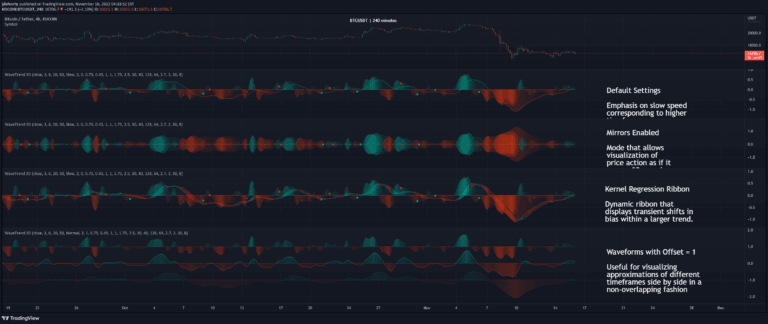
WaveTrend 3D is an advanced oscillator that uses digital signal processing and machine learning techniques to analyze price trends with enhanced precision and multi-timeframe support.
A technical indicator that highlights previous day's high and low points, uses daily and weekly separators to create a clean chart that helps traders understand potential market direction.
A multi-indicator trading tool that uses Ehlers' bandpass filter and Voss predictor to anticipate potential cyclic turning points in market price movements.
D-Shape Breakout Signals is an innovative indicator that uses semi-circular arcs to identify potential support/resistance levels and generate breakout signals with a trailing stop-loss mechanism.
Likes, views, and comments are historical TradingView snapshots. They describe attention, not trading performance.