
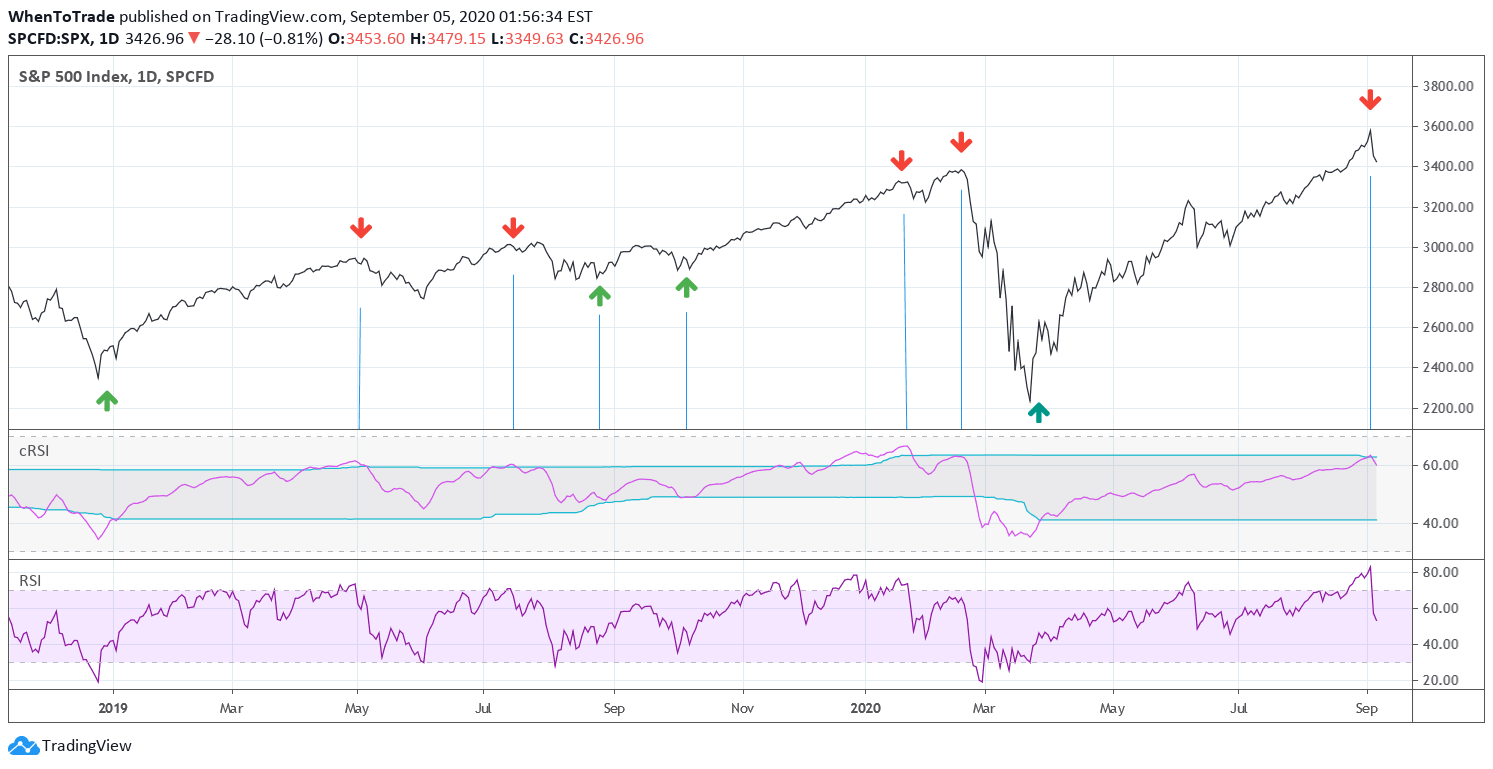
An enhanced RSI indicator that uses cyclic smoothing and adaptive bands to provide more responsive market trend signals by incorporating dominant cycle length.
Explore complementary indicator rolesHow it works
The Cyclic Smoothed Relative Strength Indicator (cRSI) builds upon the classic RSI by adding advanced smoothing techniques based on market vibration. It calculates the RSI while dynamically adjusting to the current dominant market cycle length. The indicator creates adaptive upper and lower bands that respond more quickly to price movements.
It uses sophisticated algorithmic smoothing to reduce noise and improve signal accuracy. The calculation involves analyzing market rhythm and incorporating cyclic memory into the traditional RSI formula. Traders can observe crossovers of the signal line with these adaptive bands for potential entry and exit points. The enhanced methodology provides a more nuanced view of market momentum
Why it may be useful
The cRSI offers traders a more sophisticated approach to momentum analysis by addressing limitations of the traditional RSI. Its adaptive bands provide more precise signals that can help identify market turns more accurately. The indicator's ability to incorporate market cycle length makes it more responsive to changing market conditions.
Traders can potentially reduce false signals and improve trade timing by using this enhanced momentum tool. The cyclic smoothing technique helps filter out market noise that often plagues standard RSI indicators. By understanding market rhythm, traders can make more informed decisions about trend strength and potential reversals. This approach bridges the gap between traditional technical analysis and more advanced market cycle theories
When to explore it
The Cyclic Smoothed RSI works best in markets with clear cyclical patterns and moderate to high volatility. It is particularly effective for swing traders looking to capture multi-day price movements. The indicator is most reliable when used in conjunction with other technical and fundamental analysis tools. Traders should pay special attention to crossovers of the signal line with adaptive bands during trending market conditions.
It performs well in markets with consistent price rhythms, such as cryptocurrencies, forex, and certain stock indices. The indicator is less effective in completely random or extremely low-volatility markets. Traders should combine the cRSI with volume analysis and additional confirmation signals for optimal results
Keep exploring
What we’ve verified
Access, alerts and repainting behaviour have not been independently verified for this indicator. Check the creator’s current publication and settings.
General descriptions and classifications are recovered research. Verified details above identify the specific checks we have completed. Check the creator’s current publication for later changes.


