YOUR INDICATOR RESEARCH STARTS HERE

Find the right indicator.
Understand what it does.

Explore 11,183 indicators. Filter beyond the obvious.
Discover the tools that fit the way you trade.

THE INDICATOR LIBRARY

Results for “marketcycle”

11,183 tools to explore

9 indicators matching your filters
Save search
MomentumEditor’s pick

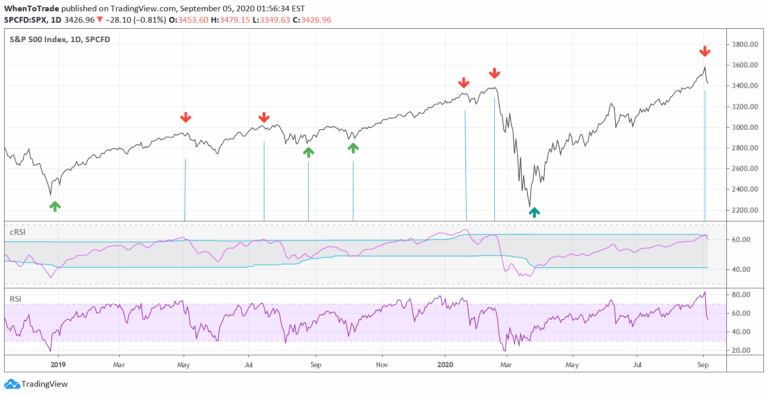
RSI cyclic smoothed v2

by StockMarketCycles

An enhanced RSI indicator that uses cyclic smoothing and adaptive bands to provide more responsive market trend signals by incorporating dominant cycle length.

Separate pane · unverifiedSwing Trading
Explore
10.4Klikes338.4Kviews106comments
Save
TrendMomentumEditor’s pick

Detrended Rhythm Oscillator (DRO)

by StockMarketCycles

A sophisticated market cycle detection method that uses Detrended Price Oscillator to identify rhythmic patterns and dominant cycles in price movements, helping traders optimize technical indicator settings.

Separate pane · unverifiedSwing Trading
Explore
3.8Klikes97.3Kviews78comments
Save
ChannelsLevelsTrend

2-Year MA Multiplier [UAlgo]

by UAlgo

A technical analysis tool using a 2-year moving average to identify long-term market trends and potential overbought or oversold conditions in an asset's price.

Main price chart · unverifiedSwing Trading
Explore
246likes4.2Kviews1comments
Save
SignalTrendVolatility

Market Cycle Phases Indicator

by PuzzlerTrades

A market cycle indicator that identifies and color-codes four distinct market phases using moving averages and volatility, helping traders understand market dynamics and potential trend transitions.

Main price chart · unverifiedDay Trading · Swing Trading
Explore
114likes3.7Kviews1comments
Save
Trend

4-Year Cycles [jpkxyz]

by jpkxyz

A comprehensive macro trading script that tracks 4-year market cycles, providing visual representation of economic seasons and price movements across different market stages.

Main price chart · unverifiedSwing Trading
Explore
110likes1.6Kviews0comments
Save
LevelsTrend

Bitcoin: Mayer Multiple

by sito4713

The Mayer Multiple is a trading indicator that compares current price to its 200-day simple moving average, helping traders identify market conditions and potential entry or exit points.

Main price chart · unverifiedSwing Trading
Explore
76likes1.7Kviews0comments
Save
TrendMomentumSignal

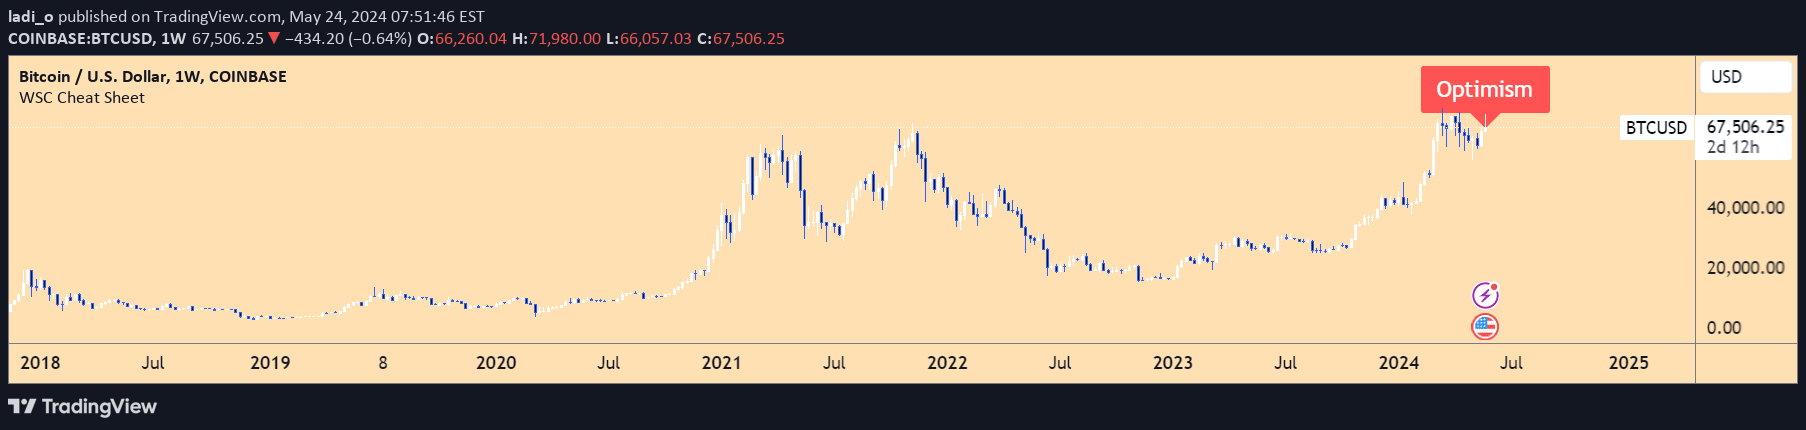
Wall Street Cheat Sheet Indicator

by ladi_o

A dynamic market psychology indicator that uses moving averages and RSI to identify and label different emotional stages of market cycles, helping traders understand market sentiment and potential trend changes.

Main price chart · unverifiedSwing Trading
Explore
55likes2.6Kviews1comments
Save

Likes, views, and comments are historical TradingView snapshots. They describe attention, not trading performance.

START WITH A QUESTION

A little less searching.
A lot more understanding.

Tell DeepAlpha what you need. Get an explanation, a shortlist,
and a direct path to the indicators behind it.

Ask DeepAlpha