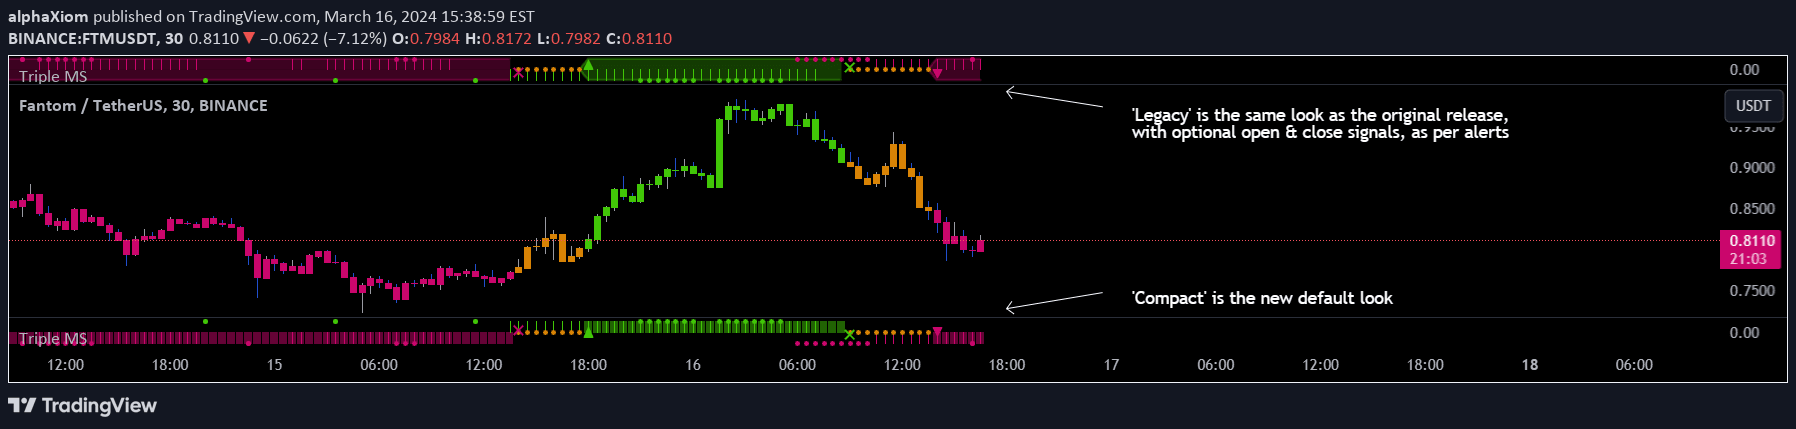
Smart Money Interest Index [AlgoAlpha]
A sophisticated indicator tracking smart money investor activities versus less informed traders, using RSI-based ratios to identify potential market entry and exit points.
Explore 11,183 indicators. Filter beyond the obvious.
Discover the tools that fit the way you trade.
11,183 tools to explore
A sophisticated indicator tracking smart money investor activities versus less informed traders, using RSI-based ratios to identify potential market entry and exit points.
Triple Ehlers Market State is an advanced trend identification indicator that uses three correlation cycles to determine market states with refined bullish, bearish, and trendless signals.
RSI OB/OS Strategy Analyzer helps traders identify overbought/oversold market conditions by calculating Relative Strength Index and generating performance metrics for potential mean-reversion trades.
A 5-minute timeframe trading system using 8 EMA and VWAP crossover with confirmation rules, designed for precise market entry in trending Indian markets.
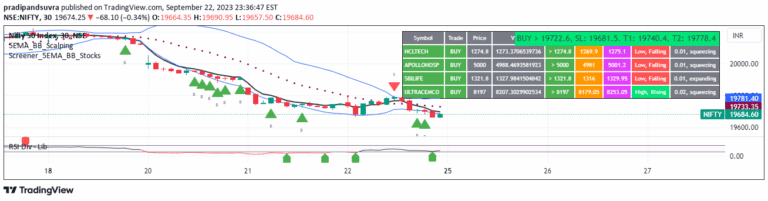
A dynamic trading scanner that identifies potential buy and sell signals for Nifty-50 stocks using 5-EMA and Bollinger Bands, providing real-time trade recommendations.
A trading indicator that calculates market momentum by tracking consecutive candle periods above or below a Simple Moving Average and predicting the next candle's potential direction.
A Bollinger Bands indicator that highlights areas outside the standard bands, helping traders identify potential price movement zones beyond typical volatility ranges.
A technical analysis tool using a 2-year moving average to identify long-term market trends and potential overbought or oversold conditions in an asset's price.
A technical indicator that detects rapid price changes in markets, highlighting dip and rip patterns to help traders identify quick buying and selling opportunities.
A drawdown visualization tool that calculates percentage retracements from an all-time high, helping traders identify key price levels and potential market support zones.
A rule-based dip buying strategy for leveraged ETFs that automates entry and exit points by tracking market pullbacks and calculating dynamic buy and sell levels.
A trading tool using Bollinger Bands to identify potential price reversals with customizable entry strategies and performance metrics across different market conditions.
Likes, views, and comments are historical TradingView snapshots. They describe attention, not trading performance.