RSI OB/OS Strategy Analyzer
RSI OB/OS Strategy Analyzer helps traders identify overbought/oversold market conditions by calculating Relative Strength Index and generating performance metrics for potential mean-reversion trades.
Explore 11,183 indicators. Filter beyond the obvious.
Discover the tools that fit the way you trade.
11,183 tools to explore
RSI OB/OS Strategy Analyzer helps traders identify overbought/oversold market conditions by calculating Relative Strength Index and generating performance metrics for potential mean-reversion trades.
A dynamic ZigZag indicator that identifies significant price reversals using percentage-based thresholds, helping traders filter market noise and detect meaningful trend shifts.
A custom vertical line indicator that allows traders to mark specified time periods on their charts, helping to visualize key time intervals across different timeframes.
A simple trading indicator that displays the open price of a specified timeframe, providing insights into market direction, support/resistance, and potential profit targets.
A drawdown visualization tool that calculates percentage retracements from an all-time high, helping traders identify key price levels and potential market support zones.
A trading tool using Bollinger Bands to identify potential price reversals with customizable entry strategies and performance metrics across different market conditions.
A dynamic trading indicator that calculates retracement levels from an asset's All-Time High, helping traders identify potential support and resistance zones during price pullbacks.
A dynamic RSI-based indicator that detects market momentum shifts by monitoring trend changes through adaptive threshold crossovers and color-coded visual signals.
A day-of-week performance indicator that calculates and visualizes cumulative percentage changes for each trading day, revealing potential calendar-based market anomalies.
An analytical tool that segments stock returns into overnight and intraday components, helping traders understand performance dynamics across different trading periods.
A trading indicator that compares performance between even and odd days, revealing potential calendar-based market anomalies and performance patterns across different trading days.
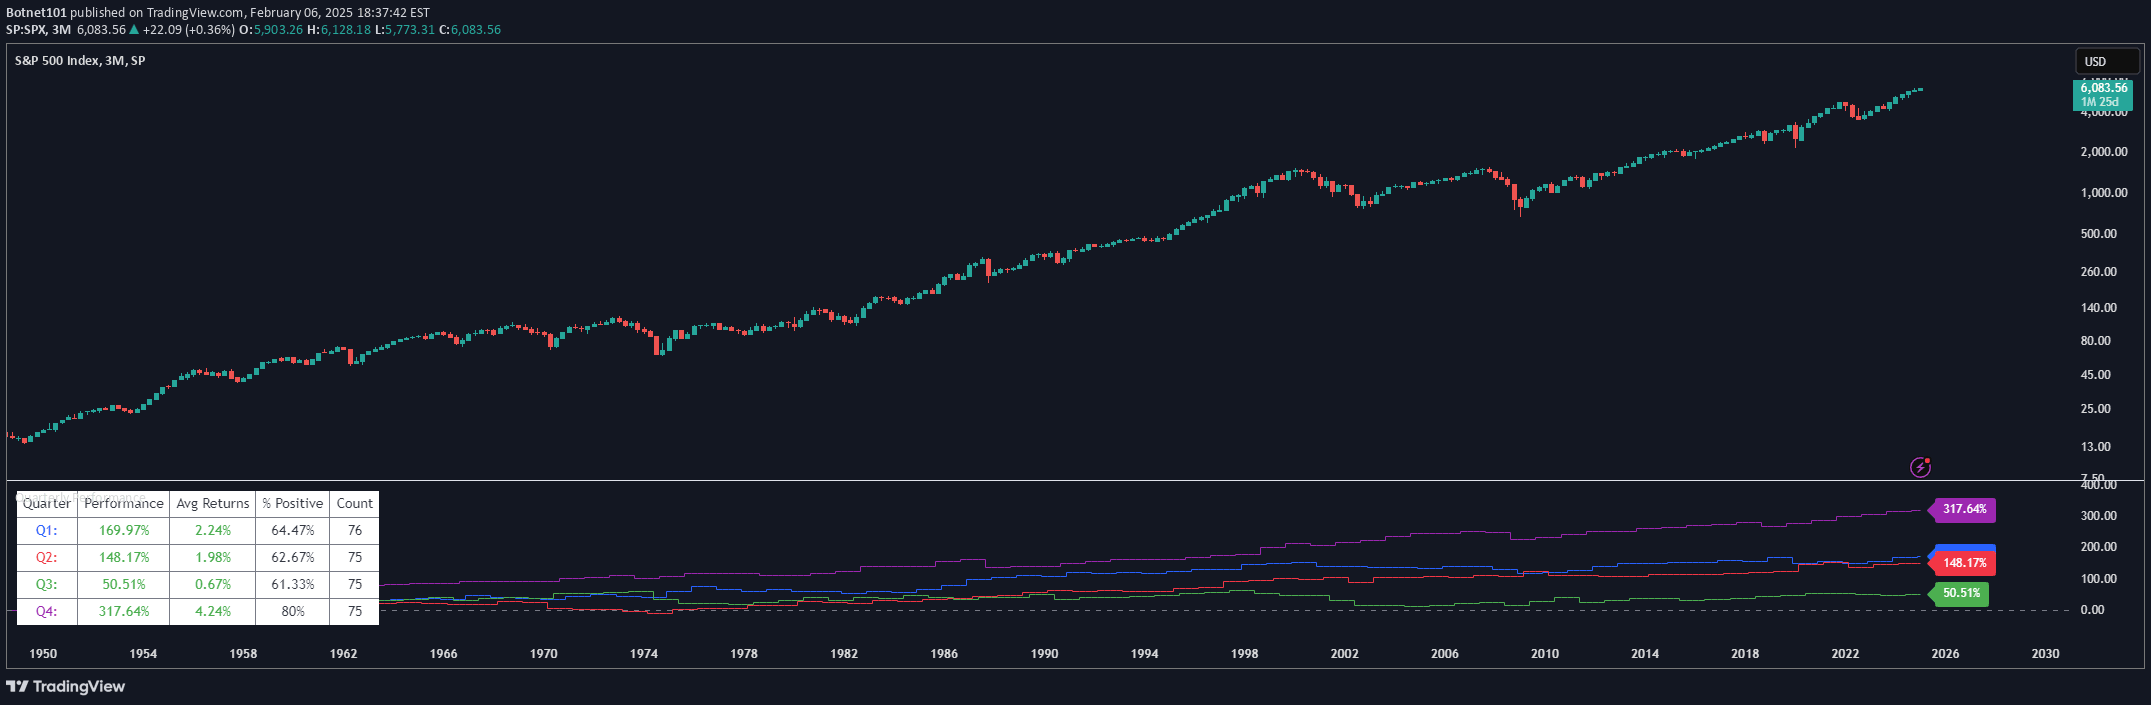
A quarterly performance indicator that explores calendar-based market anomalies by tracking and comparing cumulative returns across different quarters of the year.
Likes, views, and comments are historical TradingView snapshots. They describe attention, not trading performance.