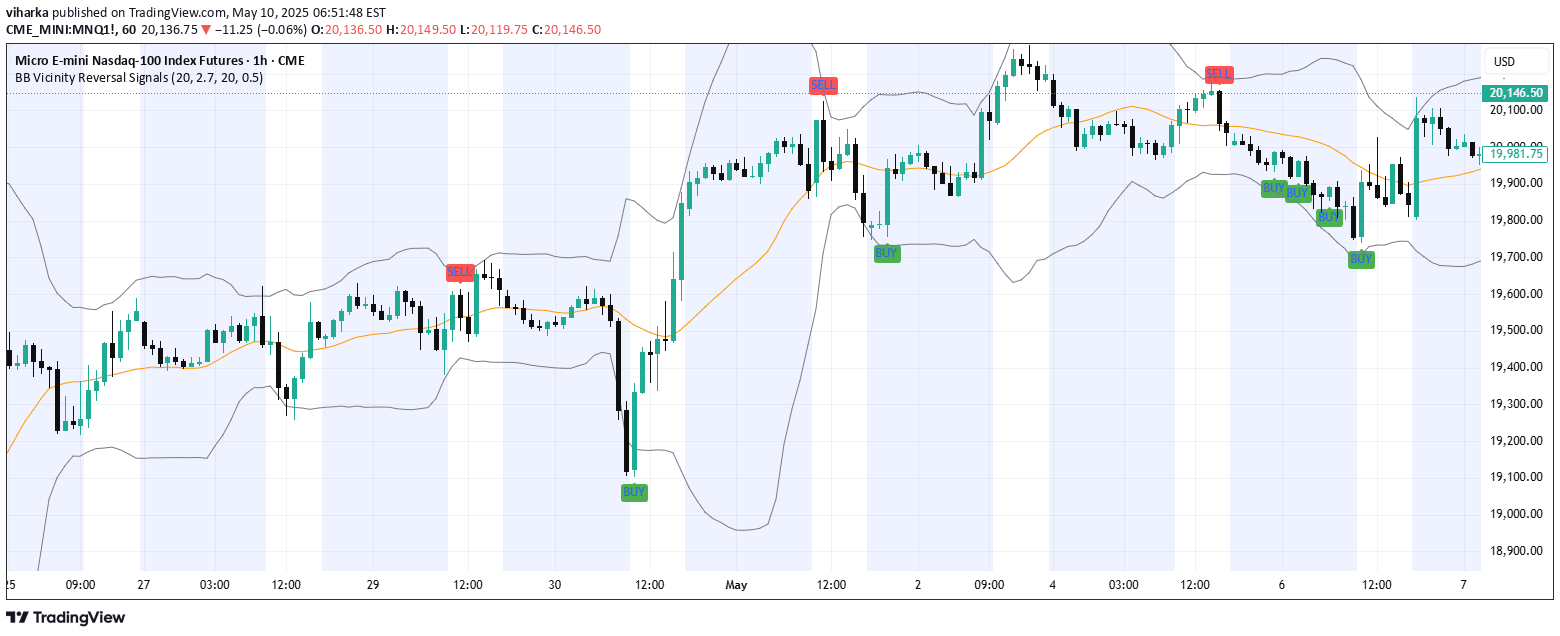
A trading tool using Bollinger Bands to identify potential price reversals with customizable entry strategies and performance metrics across different market conditions.
Explore complementary indicator rolesHow it works
The Bollinger Bands Reversal Overlay calculates standard Bollinger Bands using a middle band (Simple Moving Average), an upper band, and a lower band based on standard deviation. Traders can customize the band length and standard deviation multiplier to suit their trading style.
The indicator identifies potential reversal signals by monitoring price interactions with the bands, offering two entry strategies: Revert Cross and Cross Threshold. These strategies help traders pinpoint potential trend reversals by tracking price movements relative to the Bollinger Bands, providing visual signals and performance metrics.
Why it may be useful
The Bollinger Bands Reversal Overlay offers traders a comprehensive tool for analyzing potential price reversals, providing both visual signals and quantitative performance metrics. By breaking down win rates, mean returns, and median returns, traders can gain deeper insights into the effectiveness of their trading strategies.
This indicator helps traders make more informed decisions by offering a systematic approach to identifying high-probability reversal opportunities. The customizable features and performance tracking enable traders to refine their strategies, understand market dynamics, and potentially improve their trading outcomes.
When to explore it
The Bollinger Bands Reversal Overlay is most effective in markets with clear mean-reverting tendencies, where prices frequently oscillate around a central tendency. It works particularly well in range-bound or consolidating markets where prices tend to bounce between support and resistance levels.
Traders should utilize this indicator when seeking to identify potential trend reversals, especially in markets with moderate volatility. It is particularly useful for swing traders and mean reversion strategies, providing a structured approach to timing entry and exit points based on price interactions with Bollinger Bands.
Keep exploring
What we’ve verified
Access, alerts and repainting behaviour have not been independently verified for this indicator. Check the creator’s current publication and settings.
General descriptions and classifications are recovered research. Verified details above identify the specific checks we have completed. Check the creator’s current publication for later changes.